
Data for Victoria include detailed components of population change and population by single year of age and sex, including historic estimates from 2011.
Status
Data and insights
current
Published:
Last updated:
On this page:
Projections are based on trends and assumptions for births, life expectancy, migration, and living arrangements across all of Victoria.
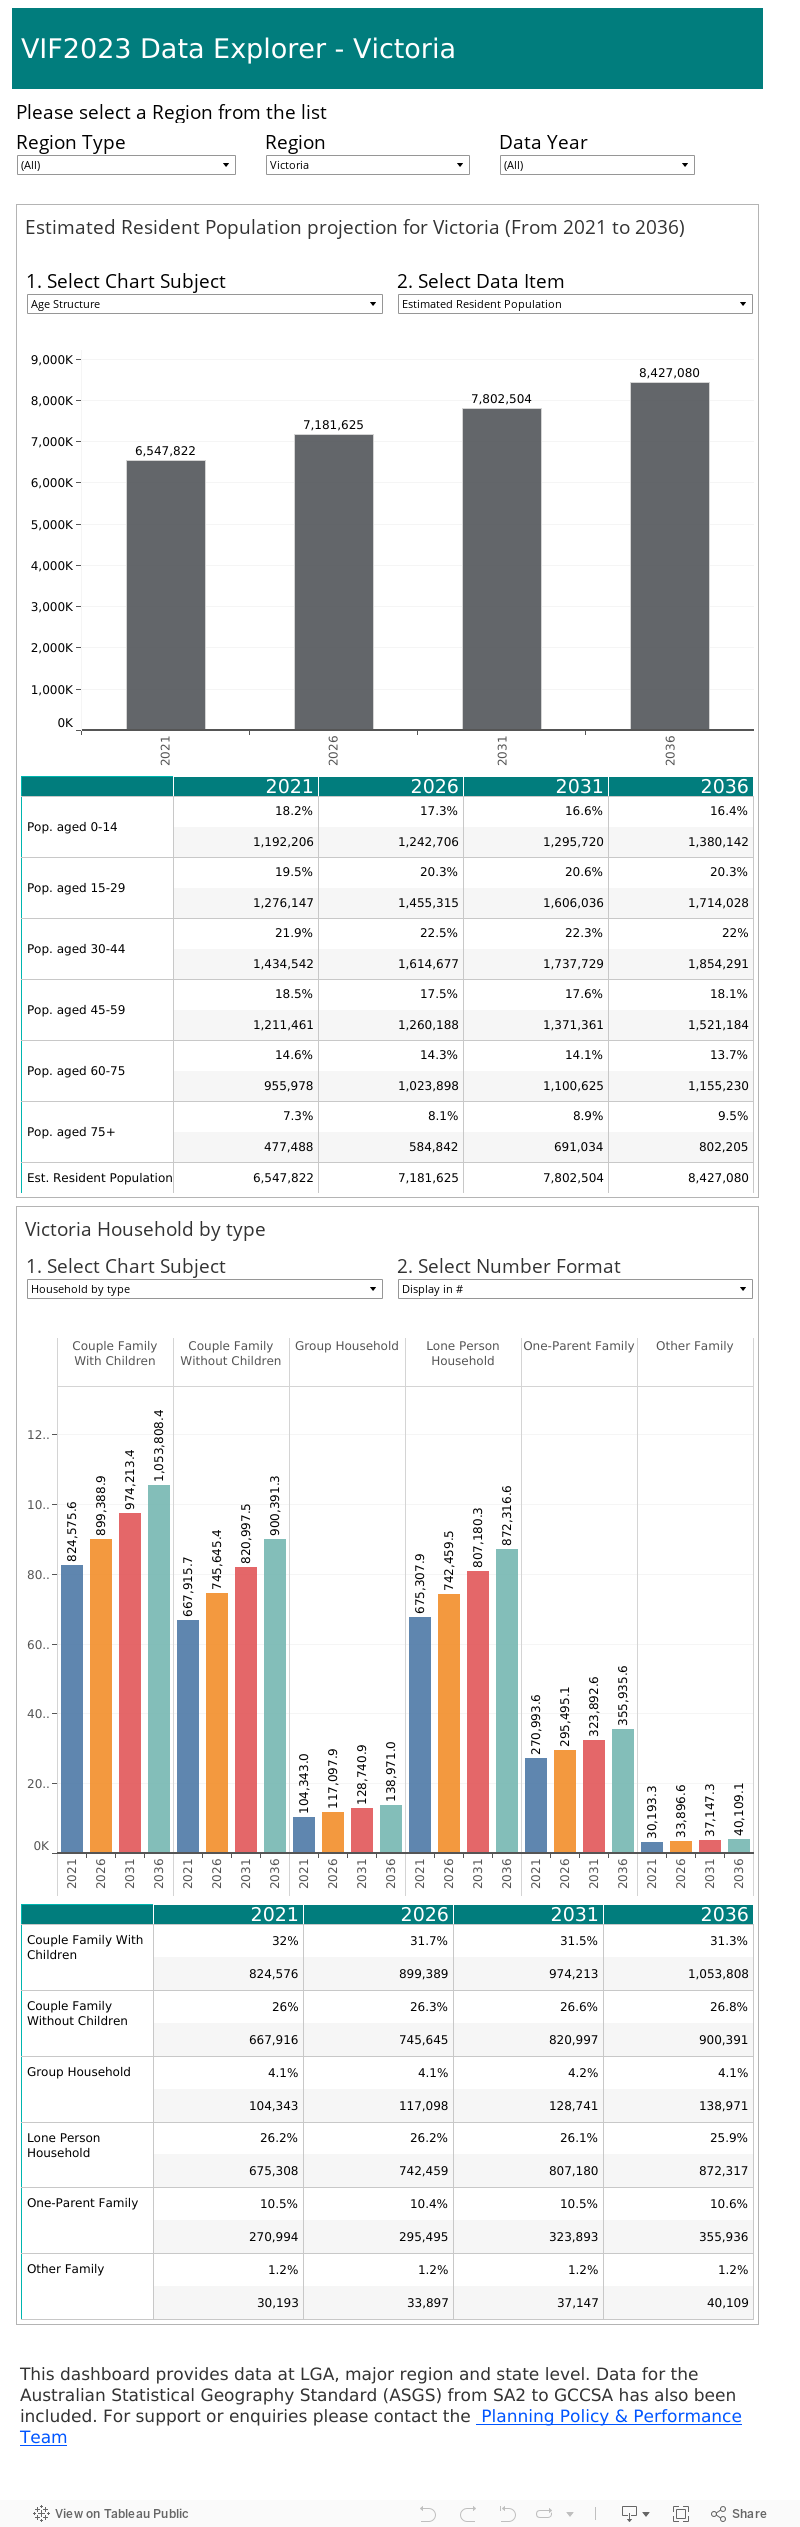
Victoria in Future 2023
Victoria in Future 2023 (VIF2023) covers the period 2023 to 2051 for Victoria and the major regions.
It covers the period to 2036 for Local Government Areas and the statistical areas in the Australian Statistical Geography Standard (ASGS). The smallest area for projections is the Statistical Area Level 2 (SA2).
VIF2023 shows Victoria remains the fastest-growing state in the country with our population expected to reach 10.3 million by 2051.
The data provides projections and covers the following:
- Total population
- Components of population change
- Population by age and sex
- Households and household types
- Dwellings by occupancy
Download data
Victoria in Future 2023 (VIF2023) data is available as Excel spreadsheets.
Data are available either for individual years or every fifth year, depending on the dataset and its source data. Where possible a 2023 estimate has been included based on the latest data published by the Australian Bureau of Statistics (ABS).
Data are available for the Estimated Resident Population, the components of population change, population age distribution, households and dwellings.
Major regions include the Metropolitan Regions and Regional Partnerships.
Data for these regions are compiled into 2 files with data for every fifth year from 2021 to 2051:
- population by age groups
- total population, household and dwelling projections.
Victoria’s 79 municipalities plus unincorporated Victoria are listed as LGAs. Data for these regions are compiled into 2 files:
- population by age groups
- total population, household and dwelling projections.
Victoria’s Statistical Areas in the Australian Statistical Geography Standard (ASGS) are listed for each level from Statistical Area Level 2 (SA2) to Greater Capital City Statistical Area (GCCSA). Data for these regions are compiled into 2 files:
- population by age groups
- total population, household and dwelling projections
Victoria in Future 2023 data is available in one-page profiles for individual regions providing the highlights of population and household change. Use the selector at the top of the page to choose a region to view. The PDF below is an example of what can be saved from the Excel template.
Explore data
The VIF2023 data explorer shows projections by LGA, major region and state level, as well as all regions in the Australian Statistical Geography Standard (ASGS), from Statistical Area Level 2 (SA2) to Greater Capital City Statistical Area (GCCSA).
Select a region group, region and years of interest. You can also select a subject group – population, households or dwellings – to get a range of detailed data as charts or tables.
The dashboard is optimized for desktop computers. There is a full screen button at the bottom right of the dashboard if required.
For assistance or further information email policy.performance@delwp.vic.gov.au
If you experience an Unexpected Error when using this dashboard, it may be related to the local cookie settings.
To fix this issue: under Settings > Privacy > Content settings, change the cookie settings to "Allow local data to be set" or try to open in Firefox
Geographic area definitions
Metropolitan regions
There are six Metropolitan Regions. They consist of entire LGAs except for Mitchell Shire. The southern part of Mitchell Shire, within Melbourne’s Urban Growth Boundary, is in the Northern Region while the remainder of the Shire is within the Goulburn Regional Partnership.
The table below lists the LGAs in each Metropolitan Region.
| Metropolitan Region | LGAs |
|---|---|
| Inner Metropolitan |
|
| Inner South East |
|
| Western |
|
| Northern |
|
| Eastern |
|
| Southern |
|
Regional Partnerships
There are nine Regional Partnerships
| Regional Partnerships | LGAs |
|---|---|
| Barwon |
|
| Central Highlands |
|
| Gippsland |
|
| Goulburn |
|
| Great South Coast |
|
| Loddon Campaspe |
|
| Mallee |
|
| Ovens-Murray |
|
| Wimmera Southern Mallee |
|
Australian Statistical Geography Standard (ASGS)
Victoria in Future provides data for regions in the Australian Statistical Geography Standard (ASGS), from Statistical Area Level 2 (SA2) to Greater Capital City Statistical Area (GCCSA). In Victoria there are:
- 522 SA2s
- 66 SA3s
- 17 SA4s
- 2 GCCSAs (Greater Melbourne and Rest of Victoria)
Visit the ABS website for more information on the ASGS.
About Victoria in Future
Purpose
Victoria in Future projections are an estimate of the future size, distribution and composition of the population. The projections give an idea of what is likely to happen if current trends continue. They are developed using mathematical models and expert knowledge, relying on trend analysis and assumptions about future change.
VIF projections are an important guide for planning and building for our future. State and local governments and agencies use the projections to plan for land use and development, infrastructure, services and programs. Developers and businesses use them to analyse potential markets, for example future demands for dwellings, goods and services and labour supply.
Clause 11.02 of the State Planning Policy Framework explicitly requires planning for urban growth to have consideration to Victorian Government population projections.
VIF2023 is not an exact prediction or forecast of the future. Uncertainty about the future increases over longer projection horizons and with smaller disaggregations, geographic or sectoral. Different policy settings and changes in the economy could result in changes to the expected size, distribution and characteristics of the population.
Geographical areas not included
VIF2023 does not provide projections for the following geographical areas:
- Australia
- Other states/territories
- Suburbs and towns
- Postcode areas
- SA1s
The ABS produces population projections for Australia and other states/territories. These projections are available at the ABS website.
VIF2023 updates
VIF2023 was produced to take account of the results of the 2021 national Census and incorporates ABS population data as at 30 June 2022 (as published in ABS National State and Territory Population, June 2023).
The VIF2023 projections will be tested against new published data when it becomes available, and a new Victoria in Future prepared as necessary.
Future population and households data
VIF2023 projections are an indication of possible future populations if current demographic, economic and social trends continue. They are not predictions of the future, nor are they future targets.
The projections take into account current government policy measures that explicitly affect the sizes and distributions of future populations. They do not consider policies that may be introduced in the future.
How do these projections differ from other population projections?
Both the ABS and VIF use the cohort component model, which begins with a base population for each year of age and sex and advances it year by year, applying assumptions regarding future fertility, mortality and migration.
One key difference of methodology relates to migration within Australia. VIF2023 models the migration flows between Victoria and the other individual states and territories, and between the regions of Victoria, while the ABS models the flows between each of the Greater Capital Cities and Rest of State areas and the rest of Australia as a whole.
Further differences result from VIF2023 and the ABS choosing different assumptions for the key drivers of population change: fertility and mortality rates and level of overseas migration. VIF2019 assumptions are detailed in another question.
VIF2023 projections are more detailed geographically than the ABS. The ABS projections are produced for the Capital City and Rest of State Statistical Areas (15 areas) and aggregated into States and Territories and Australia. VIF2023 projections are prepared first for Victoria, then LGAs in Victoria are calculated, ensuring they add up to the larger relevant totals. LGAs are aggregated to form Metropolitan Regions and Regional Partnerships.
VIF2023 also aggregates the projections into Local Government Areas (79 LGAs in Victoria plus Unincorporated Victoria) and Victoria in Future Small Areas (191 VIFSAs) specifically designed by DELWP to provide more local information within each LGA.
For the smaller geographical areas, DTP gathers, analyses and uses information about local land supply and patterns of residential development as a significant input to the VIF2023 projections to ensure that the VIF projections are realistic and take into account local influences on population change.
VIF2023 is independent of other projections of populations, prepared for example by local governments or private businesses
VIF2023 projections comparison
VIF2023 updates VIF2019 and broadly uses the same methodology but makes different assumptions, based on up to date data and any new trends detected since the publication of VIF2019. VIF2023 uses the results of the 2021 Census, whereas VIF2019 was based on the results of the 2016 Census. The base population for VIF2023 is the Estimated Resident Population as at 30 June 2022.
After the publication of the 2021 Census, the population of Victoria was found to be approximately 100,000 lower than previously reported by the ABS. This ‘rebasing’ has been included in the VIF2023 population, as has the impact of population decrease during the COVID pandemic period. VIF2023’s population estimate for 2023 is 6.8 million, where VIF2019 estimated the 2023 population to be 7.1 million. VIF2019 projected the state’s population to reach 10.6 million by 2051. VIF2023 projects the population to reach 10.3 million by 2051.
VIF2023 and Census differences
VIF2023 projections incorporate Census data in making assumptions, but the official population estimate used in the projections is the Estimated Resident Population (ERP). This is the official estimate used by the ABS to record the population and is used for purposes such as funding distribution and electoral boundary changes. It is different from the Census count as it uses a different method of calculation. The ERP is based on the population count from the latest Census, with the addition of quarterly components of population growth (births, deaths, population movements). It incorporates the estimated Census net undercount (to account for people who were missed from or counted more than once in the Census) and is adjusted to include usual residents who were temporarily overseas at the time of the Census but had returned by the end of the reference period, and to exclude overseas visitors who were temporarily in Australia on Census night.
The ABS produces ERPs quarterly for Australia, its states, territories and annually for sub-state/territory regions and for local government areas (ABS cat. no. 3301.0, 3218.0 and 3235.0).
Estimated Resident Population data
Victoria in Future projects future ERP, based on the ERP for Victoria at 30 June 2023 as published by the ABS in June 2022. Population projections are estimates of future populations and, unlike the ERP, are produced in advance of the reference period. Projections are developed by applying mathematical models and knowledge of likely population trends to the ERP and other existing data.
It is possible that during the life of the VIF2023 projections, the ABS will revise or update the ERP for one or more years in the past, or will publish a new estimate for one of the years for which VIF has made a projection.
We recommend that users wanting population data for a period covered by published ERP data should use that source. Projected data should be used only if the ERP data is not available for the required reference period, or if the data required is for a population at a future time period.
For more information about Estimated Resident Population, refer to the ABS,National State and Territory Population, available at the ABS website.
Methodology and assumptions
Population and households projections calculations
The projections are developed by analysing/quantifying past changes to estimate future population numbers and distribution. They are not simply a continuation of recent changes (either in number or in rate), rather they involve the application of specific assumptions about the causes/drivers of the change.
At the national, State and broad region level, fertility, mortality and migration behaviours are the drivers of change. At smaller levels of geography, dwelling availability (either through new land or redevelopment potential) and peoples housing preferences need also been taken into account.
The VIF2023 modelling process involves both approaches.
State and broad regions populations are projected by assuming that trends in fertility, mortality and migration patterns continue to apply to the current population. This provides the overall population by age and sex for each year of the projections.
For local areas within these regions, likely dwelling construction and housing capacities are developed from a range of sources including but not limited to:
- building approvals
- Urban Development Program
- Housing Development Data
- land use zoning and growth strategies.
Combined with likely person per dwelling determinants (household size and occupancy rates), this provides a measure of total population for each small area.
The large area totals (top-down) and small area totals (bottom-up) models are balanced through an implied migration model to ensure all local totals sum to the state and regional totals and that births and deaths in the existing population of each small area are plausible.
The VIF2023 population and household projections draw on 3 standard forms of modelling:
- The Cohort Component model projects the population by age and sex for each period using the basic demographic equation:
Population at end of period = Base population + Births – Deaths + Net migration
- The Housing Unit model projects the supply of dwellings available for occupation in a given area for each period using the basic equation:
Occupied dwellings at end of period = (Base stock of dwellings + new construction – demolitions) * (occupancy rate).
Using an average number of persons expected in each household, the housing unit model can also be used to determine the total projected population for each area.
- The Household Formation model allocates the population into households, based on living arrangement propensities (i.e. the distribution of people of each age and sex across household types).
The whole projection process can be summarised as follows:
Steps 1 to 2 are classified as ‘Top Down’ steps
Step 1 - The Cohort Component model is used to determine the population by age and sex for Victoria. Assumptions are made for the levels of overseas and interstate migration (as flows in and out) and for the fertility and mortality rates which are applied to the population by age to determine the number of births and deaths in the population each year.
Step 2 - The Household Formation model determines an initial control total of households for Victoria. The Census provides Living Arrangements data which in turn provide household propensities (the probability that an individual of a given age will be living in any of a range of household types, such as living alone, as a parent in a family, living in a group household etc.).
Steps 3 onwards are ‘Bottom Up’ steps
Step 3 – Expected dwelling construction from a number of project streams are brought together to determine total expected dwelling construction for each LGA. The four project streams are: broadhectare development; major redevelopment sites; major urban renewal precincts; dispersed infill development.
Step 4 - The Housing Unit model uses the projected number of additional dwellings by LGA and applies to each an expected average household size depending on the type of dwelling constructed (separate houses, semi-detached and townhouses, apartments). The resulting additional population is added to the previous year’s population to determine the total population in each small area.
Step 5 - The Cohort Component model is used in reverse to infer the age/sex distribution of each LGA population. Total population change is known (from Step 4). Assumptions about fertility and mortality rates, based on Census and ABS data, are used to determine the expected natural increase, and the resulting implied net migration. The age patterns of migration and therefore the age-based impacts of growth for each area is also derived from Census data (e.g. most migrants to inner city areas are young adults; suburban growth areas attract many families with children).
Step 6 - The Household Formation model determines the number of households of each type in each LGA. As per the state and region level projections, Census data is used to determine the number and type of households in each area based on the ages of the population and the characteristics of the area.
The models from steps 4 to 6 are iterated at least once more to ensure household and dwelling totals balance at each stage. Initial estimates may change during iterations.
Step 7 – Final small area totals are aggregated to region and state level and checked against control totals to ensure coherence of projections at all levels.
Summary of assumptions for models
The Cohort Component model requires the following inputs:
- base year estimated resident population by age and sex
- age and sex specific mortality rates
- age-specific fertility rates
- sex ratio for births
- overseas, interstate, regional migration total flows (in and out)
- overseas, interstate and/or regional migration age and sex distribution
The inputs for the Housing Unit model are:
- base year’s stock of structural private dwellings
- new dwelling construction
- stock loss rates (through demolition or conversion to other uses)
- occupancy/vacancy rates (dwellings without usual resident households)
The Household Formation model, developed by McDonald and Kippen in 1998, has been adapted to project household formation in Victoria. It applies a propensity (likelihood) to persons of each age and sex to live in each household type (including non-private households), and thus determines the number of households and average household size.
The living arrangement tables by age and sex from the 2016 Census provide the propensities used as input. The household types include:
- Couple with children
- Couple without children
- Lone parent family
- Other families of related persons
- Lone person household
- Group household
- Other household
Persons in non-private dwellings are classified and projected separately.
About projections
VIF2023 provides a single set of projections to allow analysis and decision making on a consistent base for all users.
We perform sensitivity analyses on the main assumptions, before choosing the most reasonable single set and using it to produce one set of projections. This information is strengthened by extensive research on local and regional trends, and by wide consultations with people with specialist and local knowledge.
Using VIF2023 as reference, it is possible to analyse the effects of different policy scenarios on population levels and distribution between and within the regions of Victoria.
Assumptions
The VIF2023 projections use the Estimated Resident Population for 30 June 2022 as the base population, as published in ABS National State and Territory Population, published June 2023.
Populations grow (or decline) in number from a combination of natural increase (number of births minus number of deaths) and net migration (number of people moving in from another area minus number of people moving out to another area). This constitutes the basic demographic equation:
Change in population = births – deaths + net overseas migration + net internal migration
For each of the four components of population change, one main assumption has been developed at the state level.
| Component | Measure | Assumption |
|---|---|---|
| Fertility | Total Fertility Rate (TFR) – the average number of children a woman is likely to have over her lifetime, based on age-specific and fertility rates | The assumed TFR is derived from assumptions about the fertility of women of individual ages between aged 15 and 49. A continuation of the trend of delayed child-bearing brings the TFR down from recent levels (around 1.55) to just over 1.5 by 2036. After 2036, the rates are held constant. |
| Mortality | Age-Specific Death Rate (ASDR) – the probability of a person dying during the following year, according to his/her age and sex | ASDRs improve for all ages, leading to a gradual increase in average life expectancy at birth from 82 to 86 years for males and from 85 to 89 years for females by 2051. |
| Net overseas migration (NOM) | The difference between the number of persons coming to Australia and the number of people leaving Australia, based on the concept of usual residence | In the short term, VIF2023 assumptions are developed by analysing recent arrivals and departures by visa type, and Victoria’s share compared with other States. In the short term Victoria’s NOM pattern is variable due to the return of migration following the COVID pandemic. In the longer term, NOM is expected to increase roughly in line with total population, and Victoria’s share to remain very strong in comparison to most of the state’s history (between 82,000 and 84,000 per annum from 2023 to 2051) reaching a level of 5,100 per annum from 2027/28 onwards. |
| Net internal migration (NIM) | The difference between the number of persons coming to Victoria from other Australian states/territories and the number of people leaving Victoria to live in other Australian states/territories | At the start of the projection period VIF2019’s assumptions reflect current strong NIM. However, NIM is expected to provide a positive contribution to Victoria’s population growth throughout most of the projection period. NIM reduces from +14,000 in 2018 to a long-term assumption of +8,000 from 2020 onwards. |
For sub-state projections, local fertility rates and migration patterns are specified. The assumption for mortality is the same across all areas.
Local conditions in the projections
Locally specific fertility rates, overseas, interstate and local migration patterns are used in VIF2023. Common mortality rates are applied to all regions.
One key input to the VIF projections is the availability of land and housing, including data on local vacancy rates, recent development trends and capacities for additional dwellings. The Urban Development Program (UDP) provides updated analysis on the supply of and demand for residential and industrial land across the metropolitan Melbourne, Geelong and other regional centres over the short to medium term. VIF projections takes into consideration the UDP information as well as information from local governments, property and development experts and other stakeholders who have localised knowledge.
Dwellings included in the projections
Whilst the vast majority of the population lives in households in private dwellings, non-private dwellings, which include for example hospitals, aged-care facilities, correctional institutions, boarding schools or army barracks, can represent a significant part of the population of a small geographical area. People living in these institutions tend to have specific demographic characteristics. For example, a boarding school represents a constant population of school-aged children.
In producing the projections for small areas, allowance is made for known sizeable institutions, whether they are likely to increase in size and the specific demographic characteristics of their inmates.
The numbers and characteristics of people living in non-private dwellings are explicitly accounted for in the household formation component of the VIF2023 projections, before the rest of the population is allocated to households.
Residents included in the projections
The concept of ‘resident population’, as defined by the ABS and projected in VIF, is based on where a person is usually living, regardless of nationality, citizenship or legal status. A person is regarded as a usual resident if they have been (or expected to be) residing in Australia for 12 months or more over a 16-month period, with the exception of foreign diplomatic personnel and their families. This 12-month period does not have to be continuous, to make allowance for brief stays overseas, which can be a common pattern for some long-stay migrant groups such as overseas students, business migrants and temporary employer-sponsored workers as well as Australian travellers.
In modelling overseas migration flows, VIF2023 makes separate analyses of, and assumptions for, the contribution of different categories of migrants. For example, the relationship between arrival and departure for temporary migrants versus permanent migrants (only a certain proportion of temporary migrants are assumed to become permanent residents following their short term stay).
Temporary populations
The VIF2023 projections are based on the estimated resident population as at 30 June and not on seasonal, temporary fluctuations. People are counted at their place of usual residence.
Places with large ‘temporary’ populations, like holiday destinations or farming areas with very seasonal activities, often have low dwelling occupancy rates for most of the year. While the occupancy rates in some Victorian coastal towns are increasing as permanent settlement in these areas grows, it is not uncommon to have winter occupancy rates well under 50% in some locations.
These low occupancy rates (or high vacancy rates) are recognised in the Housing Unit model part of the projection process.
VIF2023 provides a table of projected occupancy rates for all projection areas from 2021 to 2036. Areas which include significant temporary populations can be identified as those with especially low occupancy rates.
Users of VIF2023 projections should be aware of these possible seasonal changes and may need to apply local knowledge to the projections to suit their particular purposes. For example, businesses and organisations providing services may need to be aware of both the usual resident and holiday peak populations in their business/service planning.
Commentary
What is driving projected population growth in Victoria?
Over the projection period net migration is expected to account for 66%of the projected growth and natural increase for the remaining 34%. Of the 3.5 million extra population expected between 2023 and 2051, 1.1 million are expected to come through natural increase, 2.3 million through Net Overseas Migration (NOM) and 130,000through Net Interstate Migration (NIM).
Patterns of migration have been disrupted during the COVID pandemic. Victoria lost population through both overseas and interstate migration. The rapid return of overseas migration sees two years of elevated overseas arrivals and very strong NOM, followed by a smaller than average NOM in 2024/25 due to an expected elevated level of departures (following the post-COVID wave of temporary arrivals). Over the longer term, however, patterns are expected to resemble the pre-COVID period with NOM adding between 82,000 and 84,000 people to the population each year. Victoria’s NIM is expected to return to positive and gradually increase before settling at an ongoing level of 5,100 per annum from 2028 onwards.
The number of births per annum in Victoria is projected to increase from 78,000 in 2023 to 112,000 in 2051. The number of deaths is also expected to increase, from 46,000 in 2023 to 74,000 in 2051. Thus, natural increase is projected to be between 32,000 and 39,000 for most of the projection period.
The population of Melbourne will increase strongly through NOM, as over 90% of overseas migrants to Victoria are expected to settle there. But Melbourne is also expected to retain strong natural increase throughout the projection period.
In contrast, the main driver of growth in regional Victoria will be migration from Melbourne. It is projected that population ageing and the increasing numbers of deaths in regional Victoria will result in lower levels of natural increase in regional Victoria.
Which Victorian areas will grow the most?
Within Metropolitan Melbourne, the areas expected to increase the most are those with the greatest capacity for dwelling growth. Melbourne's designated Growth Areas and the three inner LGAs of Melbourne, Port Phillip and Yarra are expected to account for more than three fifths of Metropolitan population growth between 2021 and 2036.
In Victoria’s regions the largest numbers of projected extra dwellings, and thus largest concentrations of population growth, are in the major regional cities and the areas close to Melbourne. Between 2021 and 2036, the three largest LGAs (Greater Geelong, Ballarat and Greater Bendigo) are projected to account for around half of the population growth in Victoria’s regions.
Top 5 local government areas largest growth 2021 to 2036
| Metropolitan | Regional* |
|---|---|
| Wyndham (175,930) | Greater Geelong (96,890) |
| Melton (168,160) | Ballarat (96,890) |
| Casey (158,030) | Greater Bendigo (28,270) |
| Hume (109,150) | Baw Baw (21,550) |
| Whittlesea (103,580) | Moorabool (18,860) |
* Note Mitchell Shire is largely regional by area but its expected growth of 70,150 is predominantly within Melbourne’s Urban Growth Boundary and classified as Metropolitan.
Top 5 local government areas fastest growth 2021 to 2036
| Metropolitan* | Regional |
|---|---|
| Mitchell (6.0%) | Moorabool (2.7%) |
| Melton (4.5%) | Baw Baw (2.1%) |
| Wyndham (3.2%) | Golden Plains (2.1%) |
| Melbourne (3.1%) | Greater Geelong (2.1%) |
| Cardinia (2.7%) | Surf Coast (1.6%) |
* Note Mitchell Shire is largely regional by area but its expected growth of 70,150 is predominantly within Melbourne’s Urban Growth Boundary and classified as Metropolitan.
Maps showing projected annual average rates of change for LGAs in Victoria between 2021 and 2036 are published in the VIF2023 brochure.
Why will the number of households grow at a faster rate than population?
The number of households increases faster than the of population when the household size is decreasing (i.e. more households are formed for any given number of people).
A household is defined as one or more persons, at least one of whom is at least 15 years of age, usually resident in the same private dwelling. Thus, the number of households equals/represents the number of dwellings needed to house the population. Many services are planned and consumed per household, rather than for individuals. The number of households changes when complete households move in or out of an area because of migration. New household formation also occurs when a person leaves the existing household to form a new household. This may occur, for example, when an adult child leaves the parental home to partner or live alone, or when a couple separates/divorces. Households also disappear when people previously living separately move in together, or when people move into non-private accommodation.
Thus, household number growth is function not only of the size of the population, but also the way in which individuals form themselves into households, which is related to the age structure of the population, partnering and de-partnering trends, the age at which children leave the parental home, and a range of socio-cultural factors.
Why is the average household size expected to decrease?
Over the last twenty years, the average household size in Victoria has decreased, and household numbers have increased faster than the total population.
This is the results of several factors:
- an increase in the proportion of the population in the older age groups, which traditionally have the highest propensity to live in small households (alone or in a couple without children);
- an increase in the propensity for persons of most ages to live alone, and
- a decrease in the average number of children in families and an increase in the number of sole parent families.
Changes in household formation propensities over time are extremely difficult to measure and problematic to forecast. Consequently, such changing patterns have generally not been integrated in the VIF2023 projections model. The exception is the propensity for older people to live alone. The life expectancy of males is increasing at a faster rate than that of females, and therefore the gap between male and female life expectancy is decreasing. As this is assumed to continue, a lower proportion of older people are expected to be living alone at the oldest ages in the future.
Nonetheless, the projected changes in the population age structure result in a further decrease of the average household size. VIF2023 projects that average household size will decrease from 2.52 in 2023 to 2.43 by 2051.
Why is the population ageing?
The Australian population is said to be ageing because the proportion of people in the older age groups is increasing. This change in the age structure reflects two separate phenomena.
Firstly, life expectancy at all ages, especially the older ages, has risen, due to improvements in medical science and the quality of health care, and generally healthier diets and lifestyles. This increases the average age of the population.
Secondly, over the coming years, more of the ‘baby boomer’ cohort will reach the older age groups. This cohort is large in Australia. In Victoria there are currently 1.3 million people born between the years 1946 and 1965. This cohort was boosted by the large number of births as a result of high fertility rates and large number of young adult migrants in the 1950’s and 1960s.
However, over the projection period, the increase in births and continued migration of young adults will increase the number of young people in the population, therefore slowing the rate of ageing.
Page last updated: 19/12/23