
On this page:
We monitor population growth and change using population data published by the Australian Bureau of Statistics (ABS). We also use this data to develop Victoria's official population projections, Victoria in Future.
ABS data published here are updated regularly (quarterly for state level data and annually for local area data). The population projections in Victoria in Future (VIF) are updated periodically. There may be differences between the two datasets if ABS updates are more recent than VIF.
Population dashboard
The Population dashboard shows over 40 years of ABS data on the size, characteristics and growth drivers of population. Data is available for Victoria, other states and territories, and for Australia.
You can customise the time period for the data you want to view, from 1981 to 2022.
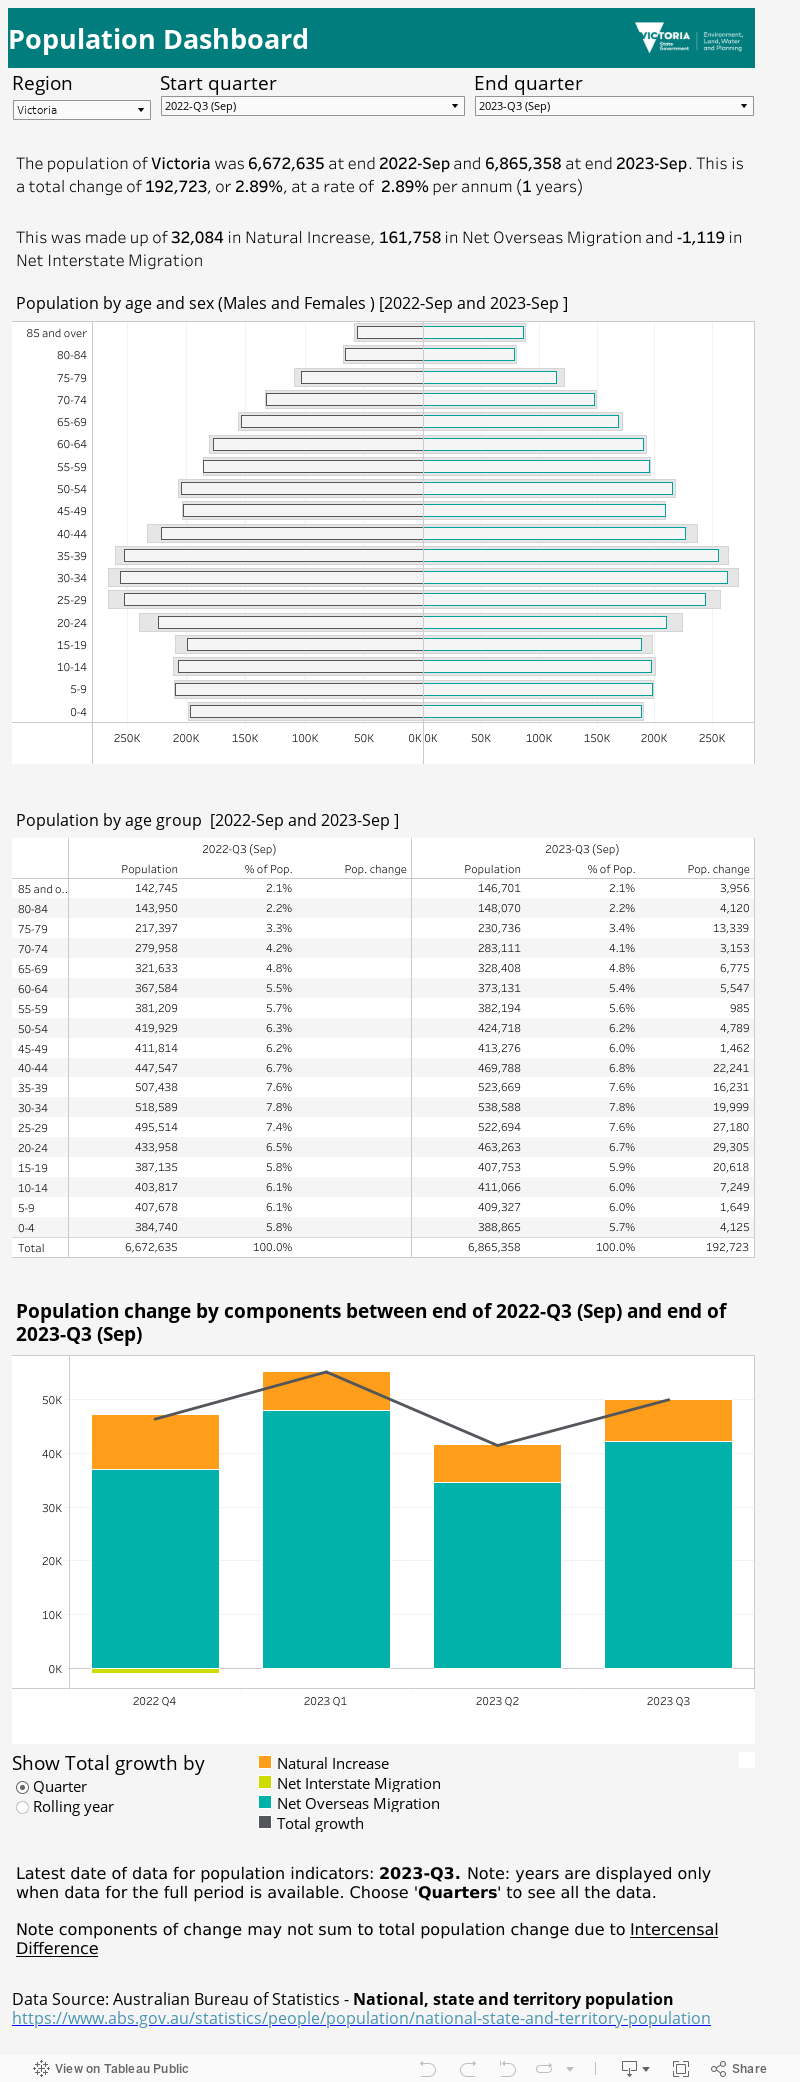
The 'Population by age and sex' chart shows the difference between the age structures at the end points of the range.
The 'Population change by components' chart shows the drivers of growth for each period during the selected time horizon.
Census 2021
2021 census data was released by the ABS on 28 June 2022. This snapshot of Australia’s population and households is used to analyse trends in behaviour and provide deep understanding essential to planning for communities.
Victorian population map
The population map brings together 30 years (1991-2020) of population change data from the ABS. Search to find the current population for an area and see how it has changed over time.
The data covers Local Government Areas and the regions of the Australian Statistical Geography Standard (ASGS) from the smallest SA2 areas up to the largest SA4 regions.
How to use the map
Population total
- Use the time slider to see a shaded population map for any year from 1991-2020 (for LGAs) or from 2001-2020 (for ASGS regions)
- Click the Play button on the time slider to see an animated view of population change over time
- Click on any region to show its population for the whole time span.
Population change
- Choose a start and end year from the drop-down options to see a shaded map of population change over that period
- Click on any region to show its population for the whole time span
Population charts
- Use the selection tools to select one or more regions (double click or hit the 'C' button to end a multi-selection)
- Display charts of population total and population change over time
- Download the data behind the charts as a CSV file (readable in Excel).
Make a map
- From any of the views you can scroll in and out to create a map view
- Use the print button to copy the map image or download as a PDF.
Page last updated: 15/08/25