
On this page:
Greenfield
The Urban Development Program (UDP) monitors land as it transitions from paddocks to lots for dwellings. By tracking the changes land undergoes through the statutory process it provides robust and reliable data. This development pipeline is split into two categories, englobo greenfield lot supply and retail lot supply.
Two stages in the englobo greenfield lot supply
1. Unzoned englobo land requiring a precinct structure plan
This is englobo land that has been identified for future residential development through the growth corridor plans and other strategic planning processes. Typically, it is currently zoned urban growth zone. This category will no longer exist once all the unzoned land undergoes the precinct structure plan (PSP) process and becomes zoned (available to be subdivided).
Lot yields for unzoned englobo land is sourced from strategic documents. If a source is unavailable a yield of 15 dwellings per hectare is applied to the assumed gross residential area.
2. Zoned englobo land
This is englobo land that has undergone the PSP process and is zoned and available for subdivision into residential lots (in general accordance with its structure plan). This stage provides a good estimate of the lot yield as it is based on the land budget provided as part of a PSP.
Lot yields for zoned englobo land are sourced from the PSP. As lots are subdivided the remaining balance of total lots is distributed across the remaining zoned englobo land. Once 80% of the estimated total lots have been subdivided the assumed yield for the remaining zoned englobo land changes to better reflect current trends and is calculated based on densities of recent subdivision within the PSP or estate plans.
Over time development may diverge from the original structure plan. In these cases, zoned englobo land will be moved or reshaped to match estate plans and the yield recalculated.
Two stages in the retail lot supply
1. Proposed lots
These are lots that are part of a proposed subdivision plan but have not yet been titled. Some changes to these lots may occur before they receive a title. The data is sourced from Vicmap parcel where they are classified as “Proposed”. Using codes within the Vicmap data and aerial imagery, lots unlikely to be typical residential housing are removed. This includes Crown land, roads, easements, parks, and non-residential uses, such as childcare centres.
2. Lots with a title
This is land that has been subdivided and titled in the relevant/previous calendar year. It has services connected and is ready for dwellings to be built. The data is sourced from Vicmap parcel where they are classified as “Approved”. Using codes within the Vicmap data and aerial imagery, lots unlikely to be typical residential housing are removed. This includes Crown land, roads, easements, parks, and non-residential uses, such as childcare centres.
Calculating years of Greenfield supply remaining
Years of Greenfield supply remaining is a calculation of the total estimated stock of lots divided by the average number of lots being titled per year.
- The stock of lots is defined as the total number of lots in the Proposed category (certified subdivisions) plus those in the Zoned category (usually Urban Growth Zone with a schedule or Residential Zone other than Low Density or Rural Living).
- Averages of lots titled per year are calculated for a short term period (2 years) and a long term period (14 years) to highlight the level of uncertainty in any expectations for the future.
- The actual Years of Greenfield supply remaining may be different due to – the stock of lots in the Zoned category changing, the density of titled lots being higher or lower than previously estimated (more yield from existing Zoned land), the rate of lots being titled being higher or lower than previous annual averages, other relevant factors such as fragmented ownership slowing development rates, or any combination of the above.
- It should also be noted that as annual consumption in this equation is based on the rate and timing at which lots are titled, the Years of Greenfield supply remaining range does not reflect the period in which lots may be pre-sold or dwellings may be constructed.
- A lot pre-sale may occur a number of years before a lot is titled and a dwelling constructed.
- It takes varying amounts of time between the issue of a lot title, issue of a building permit, construction and occupancy of a dwelling. Given usual timing in this development pipeline, dwelling construction can be expected to continue for at least two years after the issue of the last lot title.
Major redevelopment
The Urban Development Program monitors major residential redevelopment projects across metropolitan Melbourne. These are projects containing 10 or more dwellings that are within existing urban area of Melbourne that occur on sites that have often been used for commercial, industrial, or residential purposes. Data is collected through analysis of aerial imagery, planning permits, real estate websites and developer websites.
The UDP redevelopment tracks projects as they progress through the development pipeline from the supply of sites through to finished dwellings. The pipeline is broken up into three categories of supply and 5 stages of development.
For each project an estimated dwelling yield by building type (apartments, townhouses, or detached) and number of storeys is recorded. As projects progress through the pipeline, this information becomes more reliable and is revised.
Supply of redevelopment sites stages
Firm
Projects that have been approved and/or taking sales enquires and registrations. Sources include:
- LGA planning registers
- DTP’s Planning Permit Activity Reporting System (PPARS)
- subdivision data from Vicmap parcel (DTP)
- developer websites
- real estate websites.
Likely
Projects that are within the planning process, projects with recently lapsed planning permits, projects that have been sold with a recent planning permit. Sources include:
- LGA planning registers
- DTP’s Planning Permit Activity Reporting System (PPARS)
- real estate websites.
Possible
Early indicator of the location of future major redevelopment projects or projects that have been inactive for a number of years. Sources include:
- strategic planning documents
- news articles.
Development of redevelopment sites
Under construction
Building works have been identified. Sources include:
- aerial photography (DTP)
- developer websites.
Dwellings built on redevelopment sites
Completed
Completed buildings. Sources include:
- address data from Vicmap address (DTP)
- subdivision data from Vicmap parcel (DTP)
- aerial photography (DTP)
- real estate websites.
Projects within the supply section of the pipeline can move between stages (forward or backward) as new information becomes available or no information is found. Projects that are inactive will eventually be removed from the dataset.
Industrial
The Urban Development Program monitors industrial land across metropolitan Melbourne. An assessment of the development status of industrially zoned parcels is conducted each year to provide an estimate of consumption and supply.
Parcels are considered industrial if they are zoned either:
- Industrial 1 Zone (IN1Z)
- Industrial 2 Zone (IN2Z)
- Industrial 3 Zone (IN3Z)
- Commercial 2 Zone (C2Z)
- Special Use Zone (SUZ) where the planning scheme prescribes industrial uses only
- Comprehensive development zone (CDZ) in some specific cases.
Or if they have an applied industrial zone as part of a structure plan, which can occur in:
- Urban growth zone (UGZ)
- Activity centre zones (ACZ)
- Commonwealth land (CA).
Industrial land development status
All assessments are made per parcel. However, if the occupied part of a parcel is clear and there is substantial land that could be used as future supply the parcel is split and given its relevant status. Where a parcel contains known non-developable land such as road, electricity, or drainage easements or reserves these areas are removed.
Occupied
Parcels that contain industrial or commercial buildings, container parks, informal car parking, quarries, and hardstand storage areas.
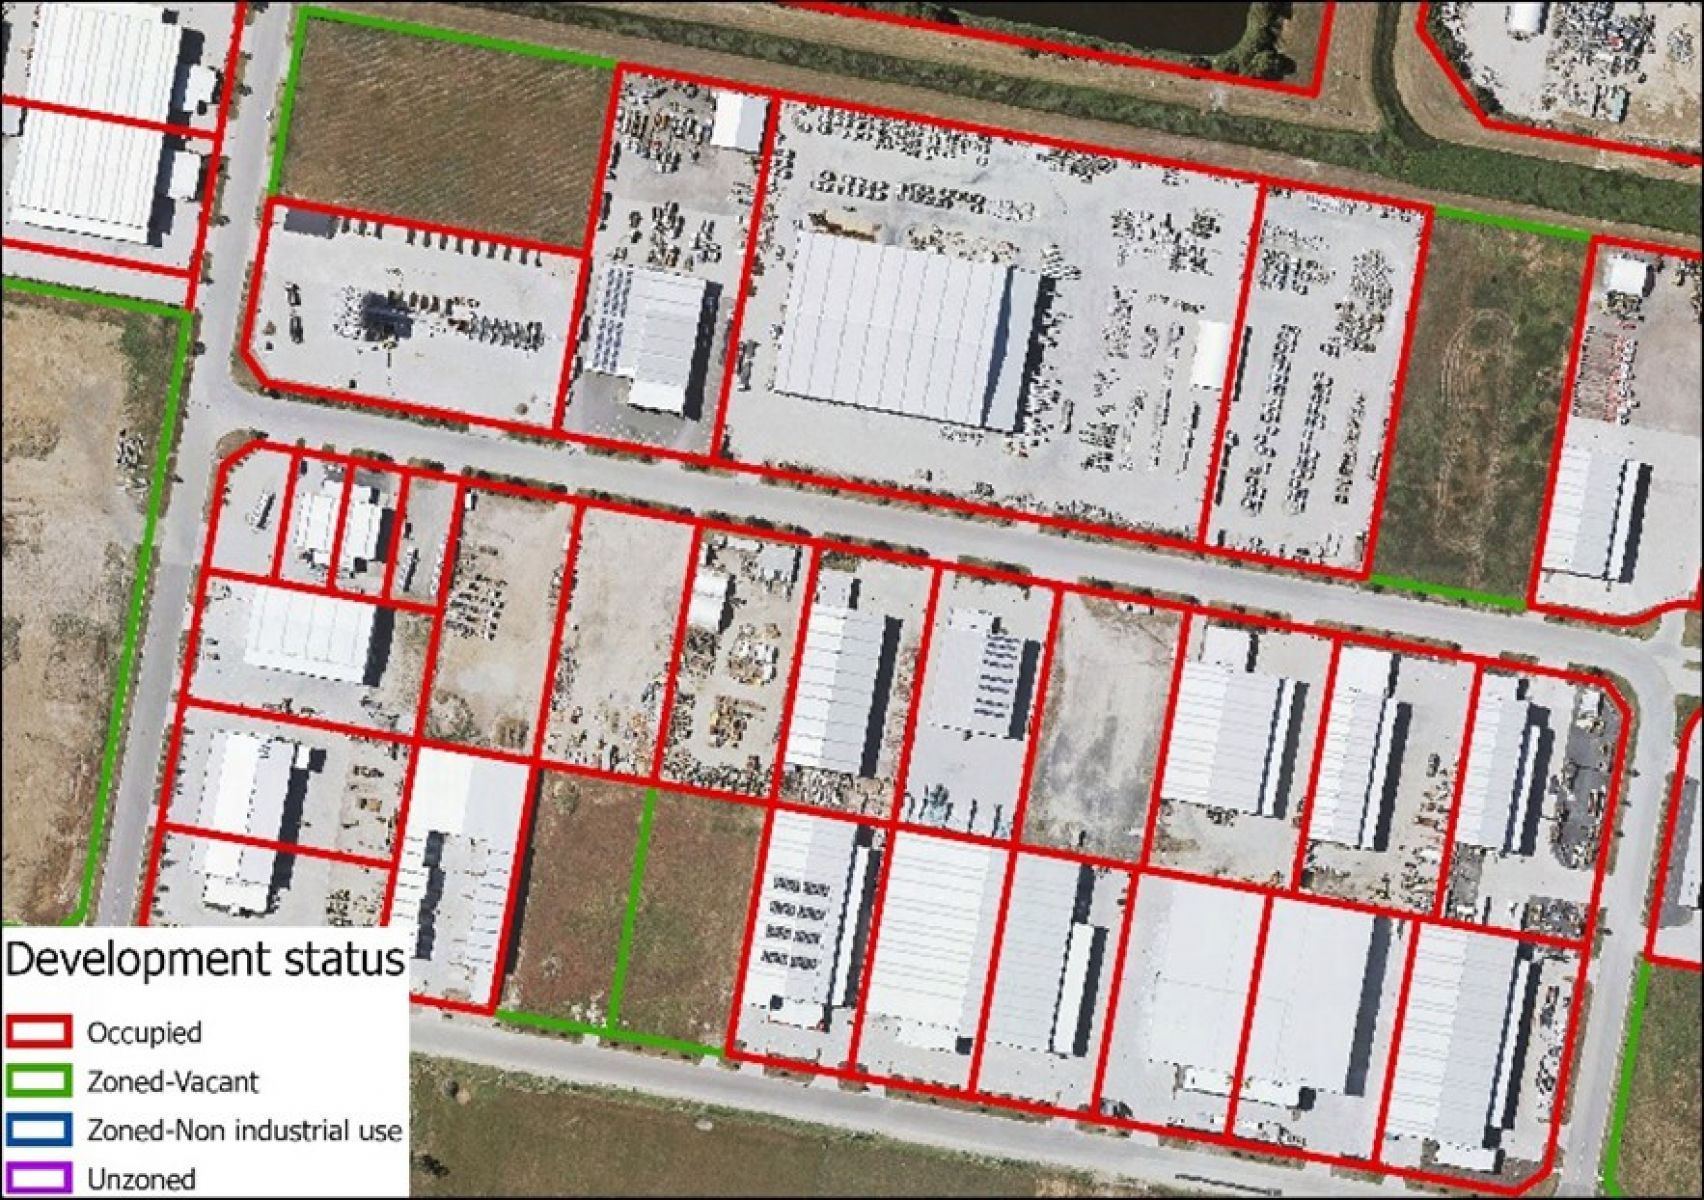
Zoned vacant
Parcels that are zoned for industrial use but have no intensive use / visible capital investment.
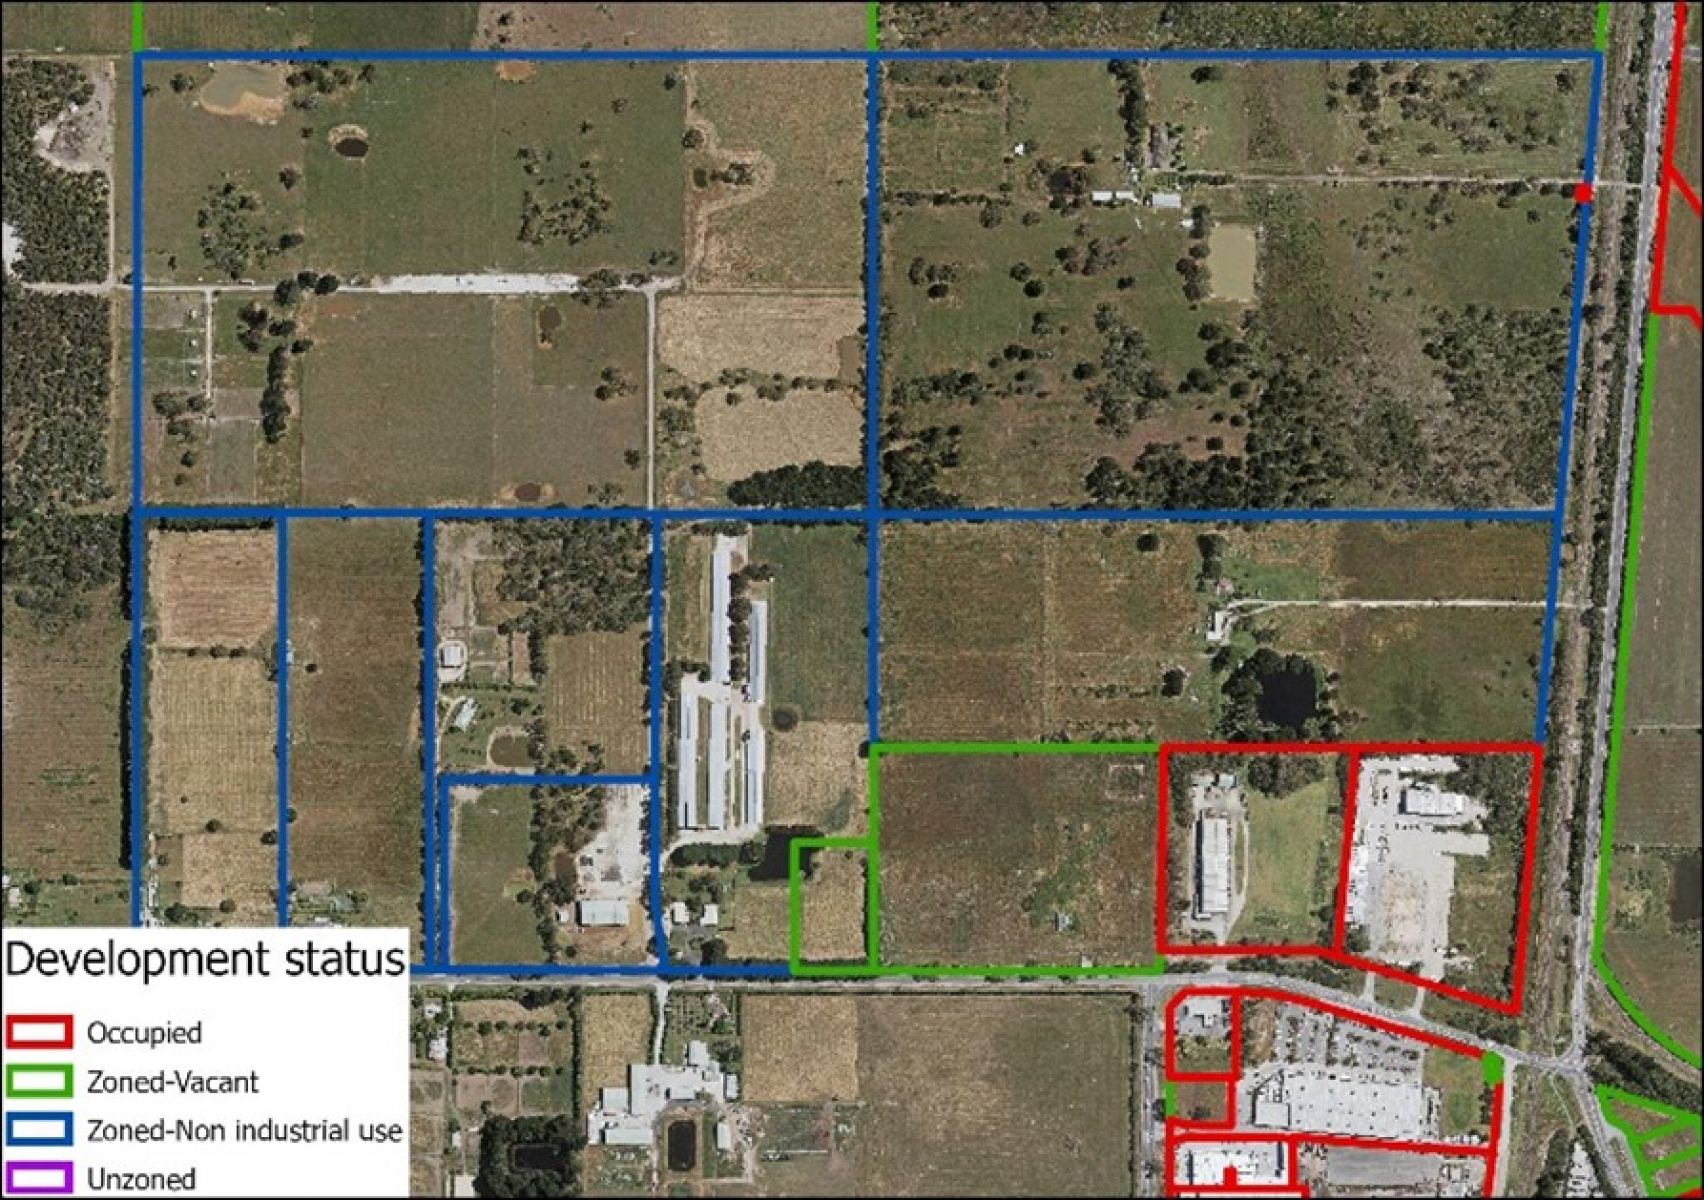
Zoned non-industrial use
Parcels that are zoned for industrial use but have an existing use /capital investment that is not industrial. Examples include residential buildings and agricultural infrastructure. Over time these are likely to be redeveloped to industrial uses.
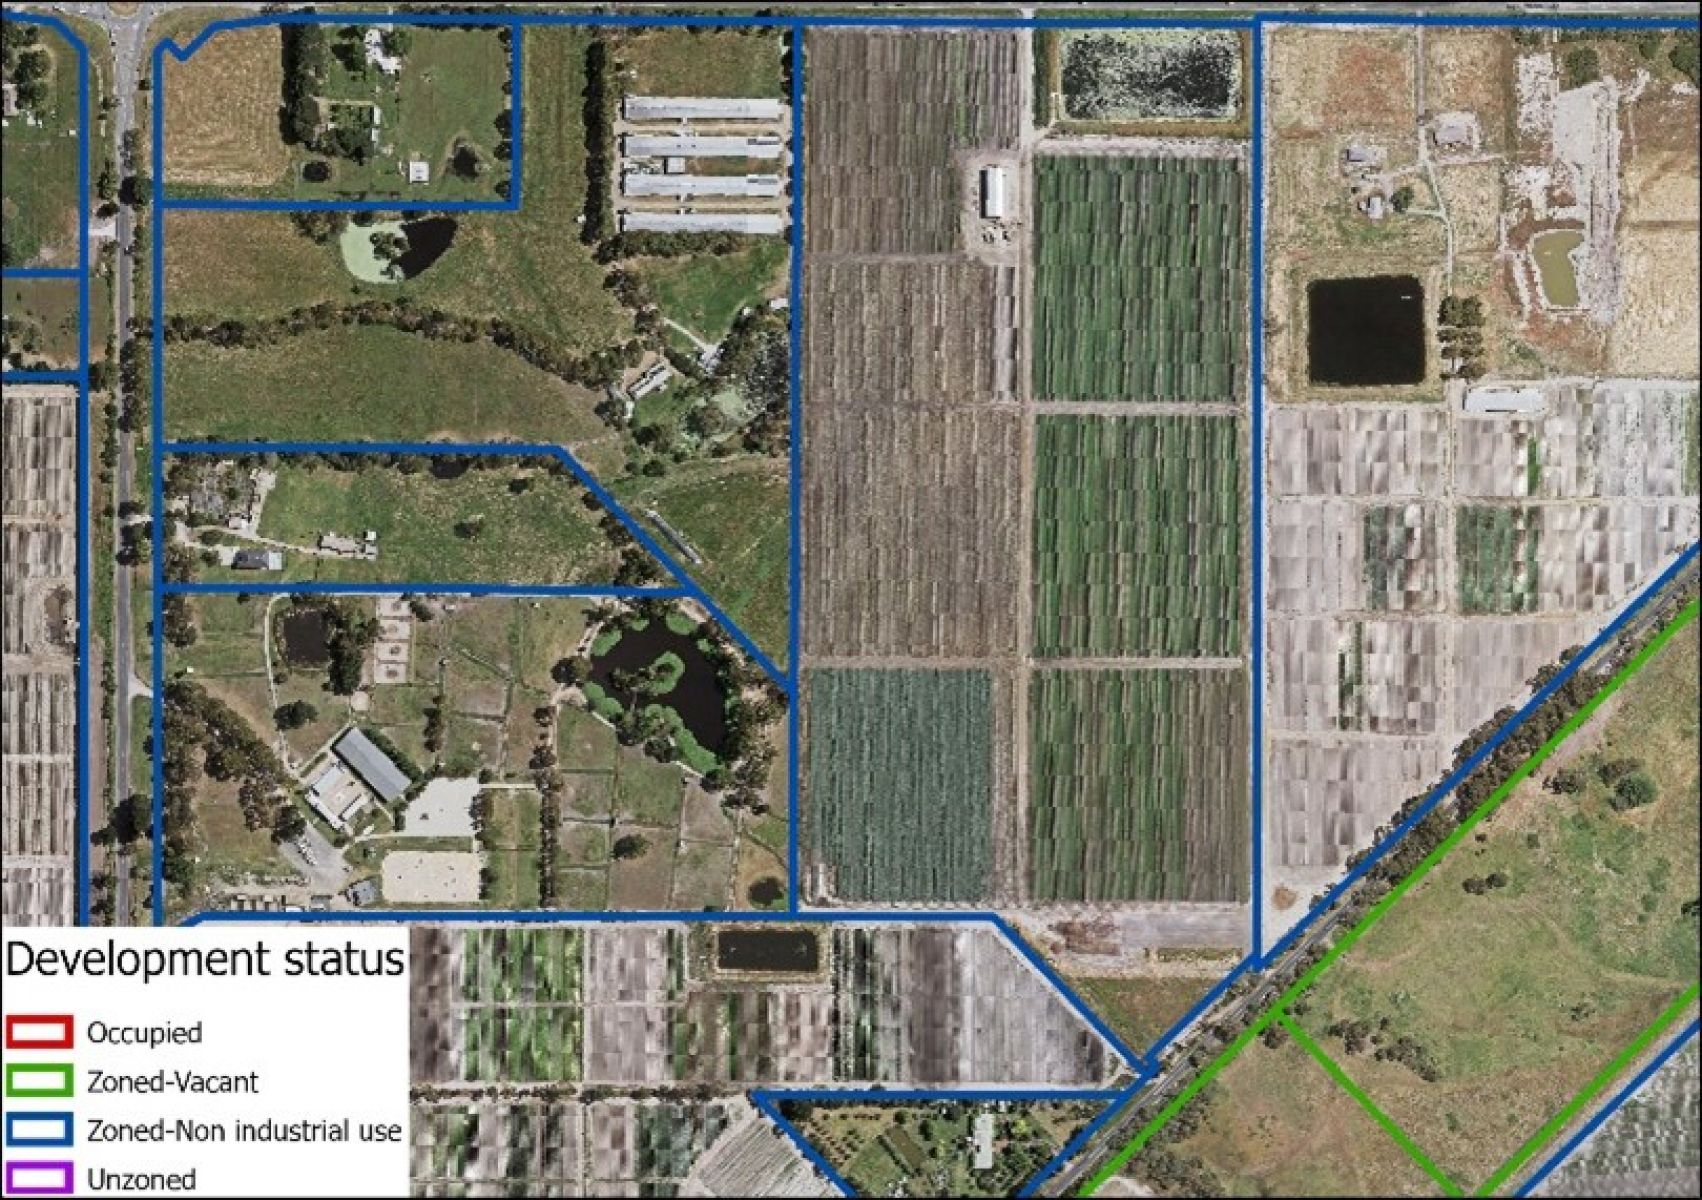
Unzoned
Parcels identified in strategic plans for future industrial purposes.
Estimating consumption for modelling exhaustion rates
Consumption rates are based on a long-term consumption trend (2005 to 2022) and a recent consumption trend (2018 to 2022) for each Significant Industrial Precinct (SSIP). The long-term consumption rates are generally lower than the recent consumption trends. This provides a range of potential times when vacant land becomes exhausted.
The method adopted in this report creates a linear exhaustion rate, however in practice, land supply in the SSIPs would become constrained prior to all vacant land being consumed. This is because:
- the amount of new development would start to decline as land prices increase in response to increased scarcity. Users might be priced out of areas and search for other locations.
- not all zoned land is suitable for development as either built space or non-built space (such as a storage yard) due to the configuration of the land such as area, shape or cost of providing infrastructure.
This modelling provides a useful estimate of the how the SSIPs will accommodate growth and the pressures they may encounter in the future.
Page last updated: 01/07/24