
On this page:
We have mapped and analysed vegetation, land use, and urban heat across Melbourne to understand the the relationship between urban vegetation cover and the urban heat island effect.
We used Urban Monitor to create the first high resolution map that records the baseline of urban vegetation across Melbourne, mapping imagery in 2014 and 2018. We can precisely measure the area of tree, shrub and grass cover at a land parcel level and track changes in this area over time.
A vulnerability assessment identified the areas that are vulnerable to heat waves. The assessment takes into account the location of vulnerable members of the community, such as the elderly, very young and those with lower capacity to adapt to heat.
This work was conducted in partnership with RMIT University, CSIRO, and the Clean Air and Urban Landscapes (CAUL) Hub of the National Environmental Science Program, and supported by our implementation partner Melbourne Water.
Vegetation, urban heat and heat vulnerability index data
2018 vegetation, urban heat, and heat vulnerability data has been added to the 2014 data.
Cooling and greening datasets available for download are:
2014 – 2018 change in vegetation cover
The interactive map consolidating 2014 and 2018 data provides a visual representation of vegetation cover, land surface temperature and the urban heat vulnerability assessment.
Find out more about the cooling and greening Melbourne map.
Summary reports
A series of reports provide an overview of the vegetation cover and urban heat data for metropolitan Melbourne. Reports were produced in partnership with RMIT University,
2018 tree cover
Metropolitan Melbourne has an urban tree canopy cover of 15.3%, based on 2018 data.
The breakdown of 2018 urban tree cover by region is shown below.
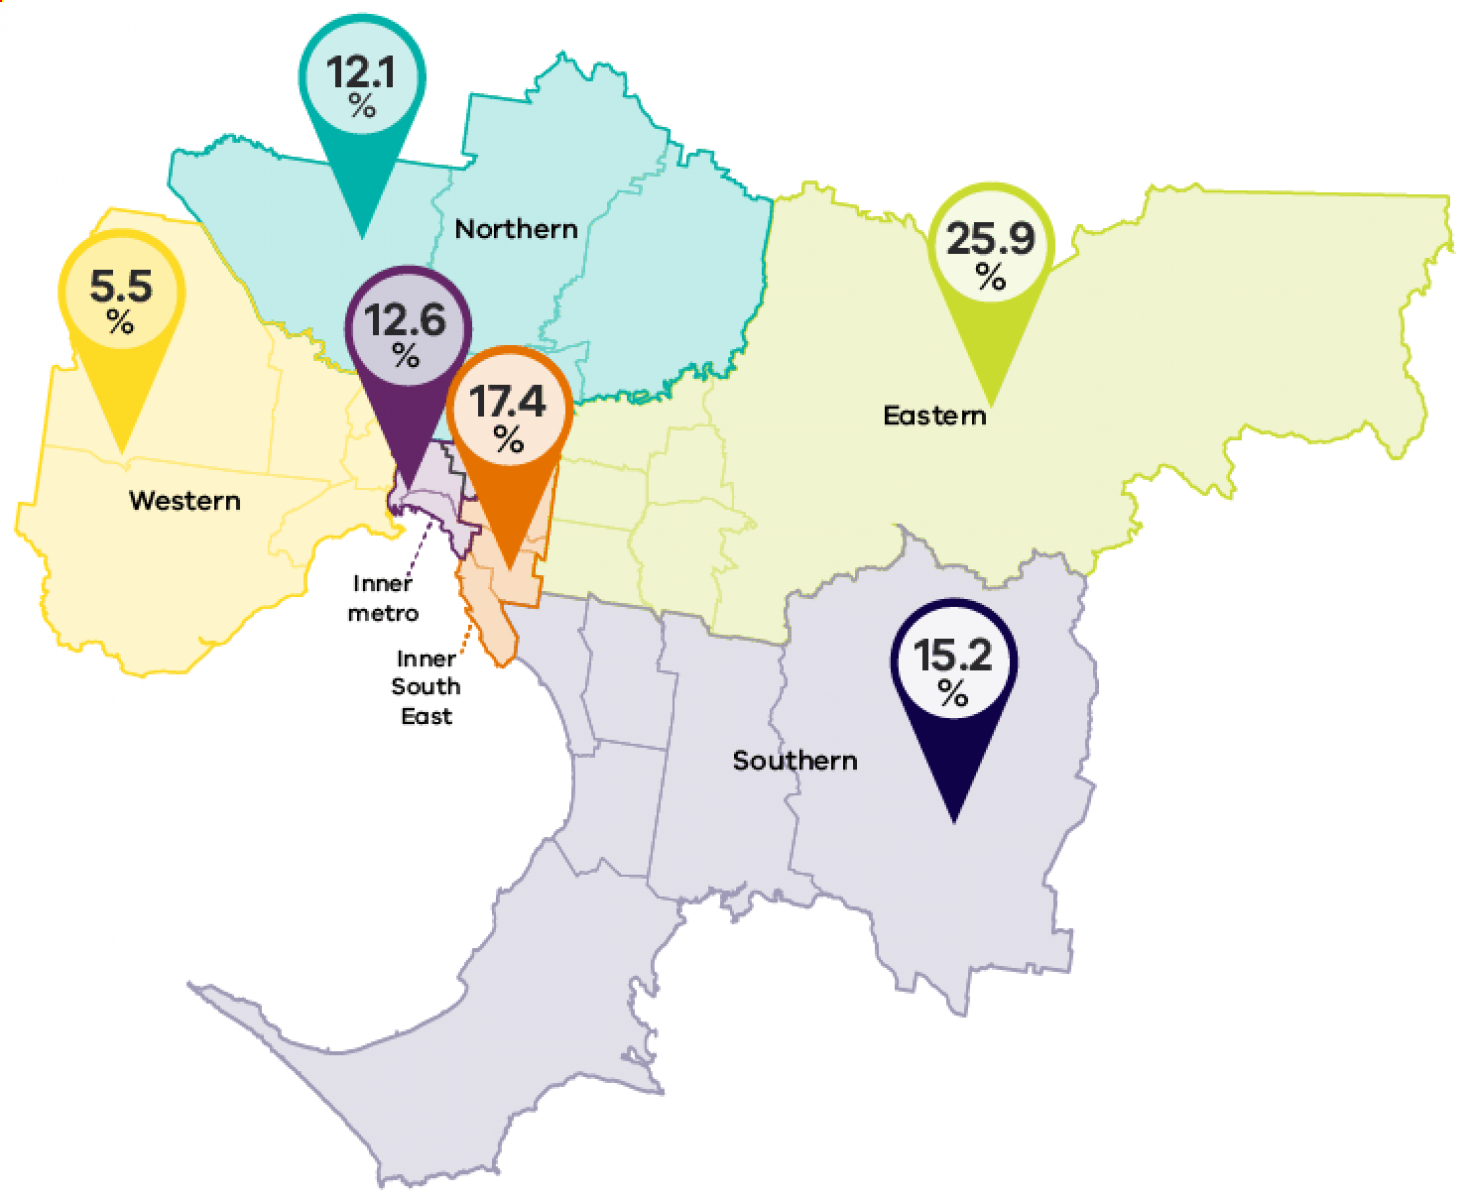
2018 % urban tree cover in Melbourne by region
- Inner metro –12.6%
- Inner South East – 17.4%
- Northern – 12.1%
- Southern – 15.2%
- Eastern – 25.9%
- Western – 5.5%
Of Melbourne’s metropolitan regions, the Eastern region has the highest urban tree canopy cover of 25.9 per cent. Of Melbourne’s local government areas (LGA), Yarra Ranges and Nillumbik have the highest urban tree canopy cover, 36.7% and 31.1% respectively.
The Western region has the lowest urban tree canopy cover of 5.5%. Melton and Wyndham LGAs have the lowest tree canopy cover, 4.1% and 4.2% respectively.
In urban areas the highest proportion of the total tree canopy cover is accounted for by:
- residential land – 46.7%
- parkland – 18.5%
- infrastructure such as streets – 15.7%
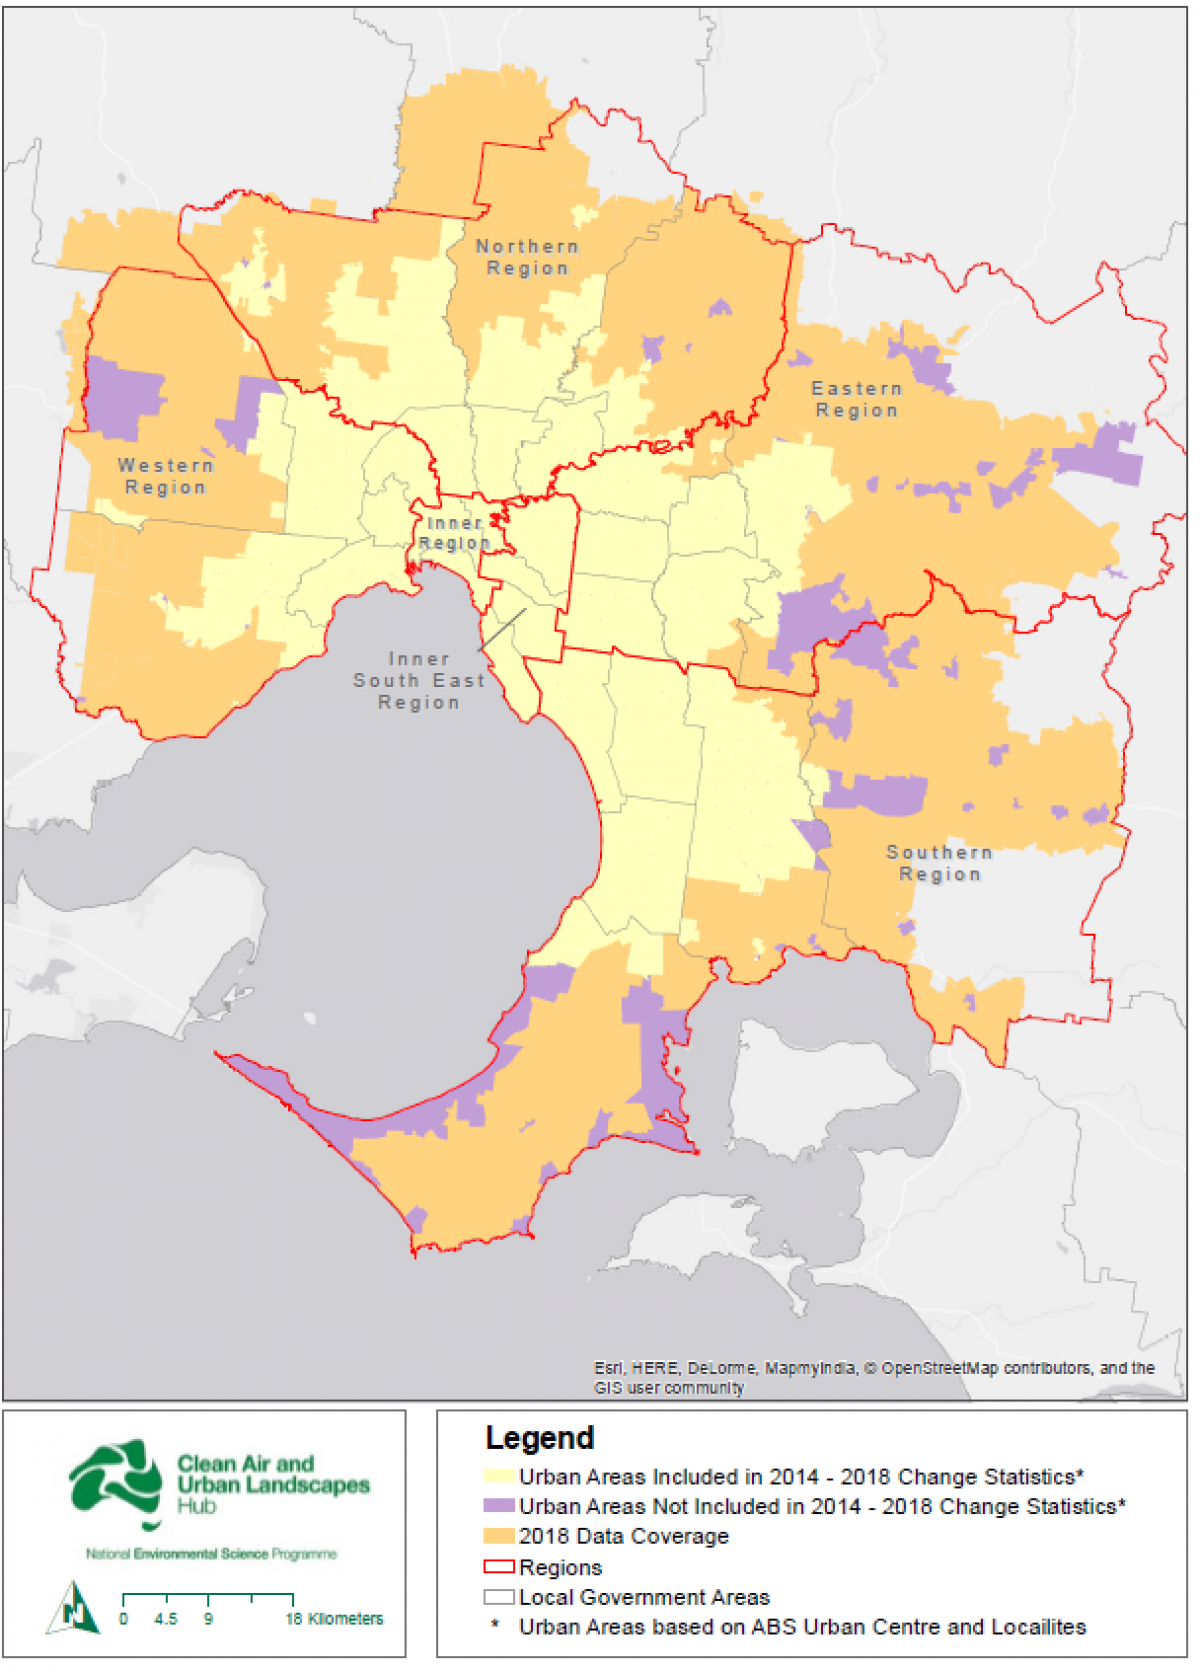
Due to the larger area of vegetation data available for 2018, the tree canopy cover findings presented in the ‘Melbourne Urban Vegetation Cover 2018’ report may be different than those in the ‘Urban Vegetation Cover Change 2014-2018’ report. The 2018 study area includes outer parts of the Eastern and Southern regions, which are typically highly vegetated. The additional data coverage is shown in purple shaded areas on Map 1 in the '2014-2018 tree cover change' tab.
Source: Clean Air and Urban Landscapes Hub 2018, Urban Vegetation Cover Analysis, Melbourne Metropolitan Region 2018, Clean Air and Urban Landscapes Hub, Melbourne.
2014-2018 tree cover change
Based on 2014 vegetation coverage data, metropolitan wide urban tree canopy cover declined from 32,980 ha in 2014 to 32,295 ha in 2018. This represents a change from 13.6% to 13.4% tree cover and a loss of 0.3 percentage points or 686 ha.
Values do not sum due to rounding.
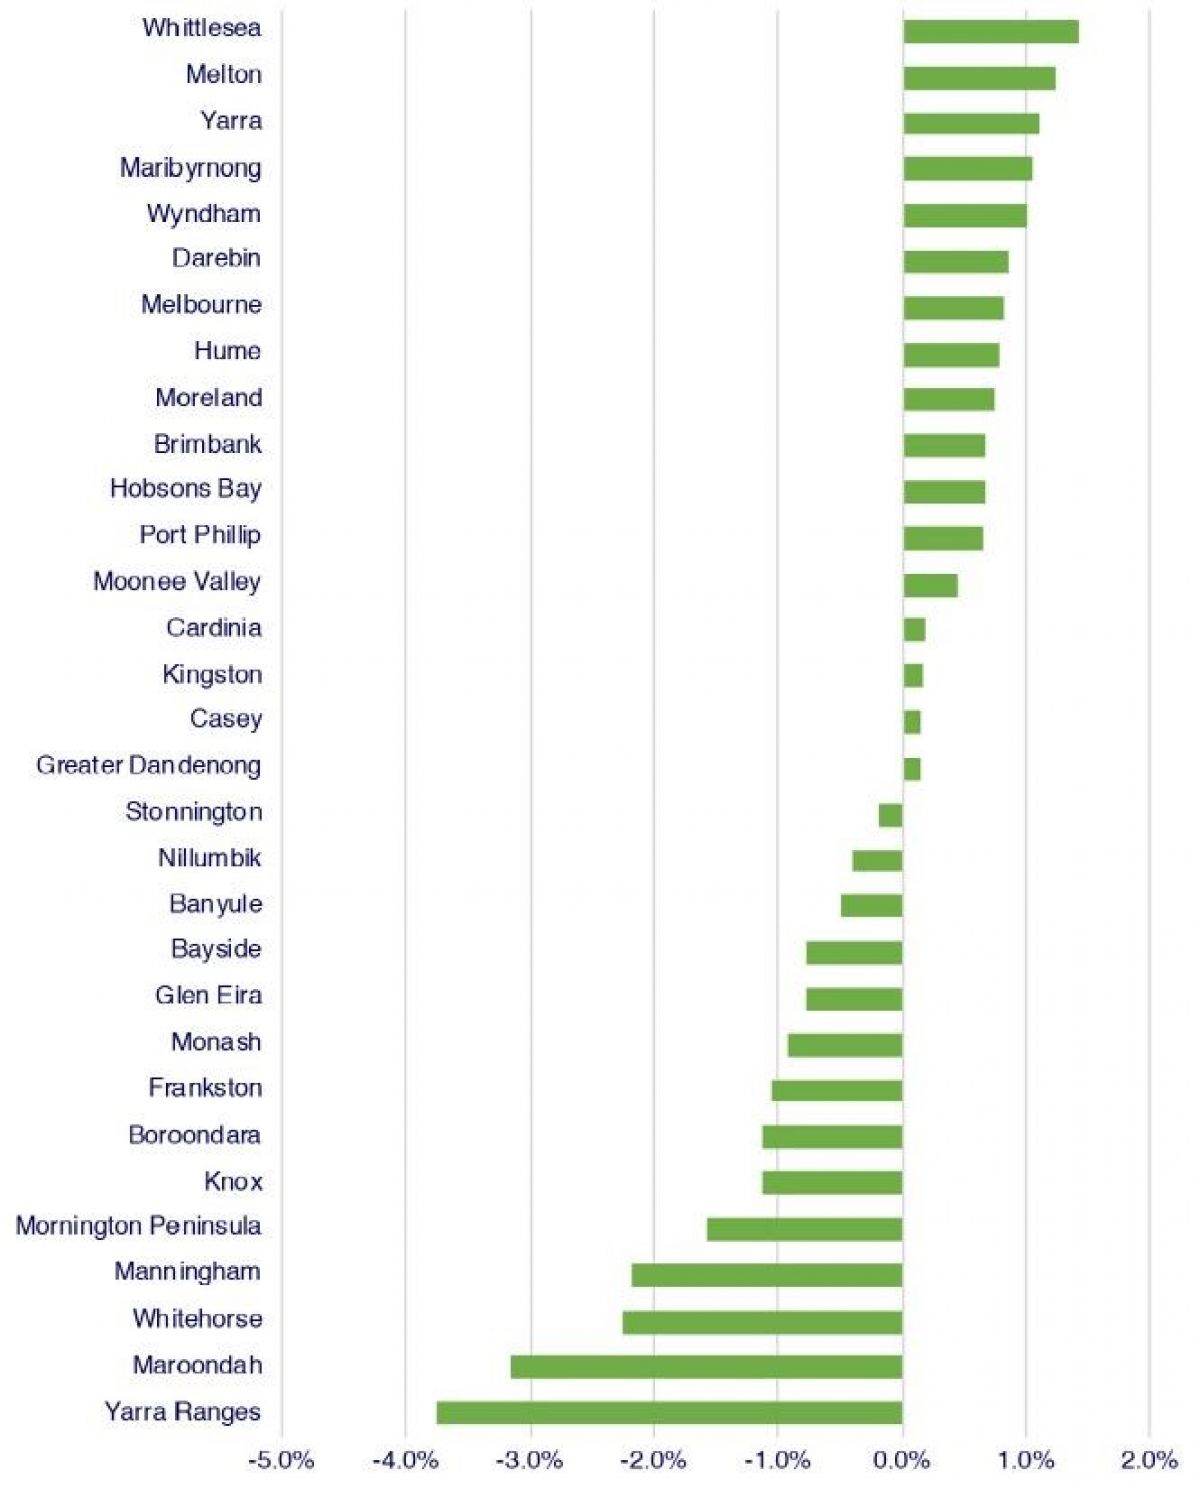
Across the Inner, Western and Northern regions there were areas where tree canopy cover stagnated or moderately increased, and a few areas where tree cover declined. In the Western and Northern regions this change is off a low baseline.
Across the Eastern, Inner South East, and Southern regions there were more extensive areas of average tree canopy cover loss, particularly in the Eastern region. In these regions, baseline tree cover is generally high compared to the Melbourne average.
Tree canopy cover loss is concentrated in areas where there is significant existing vegetation and urban redevelopment activity. The loss is most evident on residential land and parkland, which provide the largest areas of tree cover.
Tree canopy cover gain is concentrated in areas where there is limited existing vegetation.
Change by land use
Residential land
Between 2014 and 2018 residential land in Melbourne lost 737 ha of tree canopy cover. This is a change from 15.0 % cover in 2014 to 14.3 % cover in 2018, representing a loss of 0.7 percentage points.
Urban redevelopment, landowner land management practices, and climatic effects are combining to reduce urban vegetation cover on residential land.
Parkland
Between 2014 and 2018 parkland in Melbourne lost 158 ha of tree canopy cover. This is a change from 21.1 % cover in 2014 to 20.6 % cover in 2018, representing a loss of 0.5 percentage points.
Infrastructure land
Between 2014 and 2018 infrastructure land, largely the street network, experienced a gain in tree canopy cover – 229 ha. This is a change from 13.3 % cover in 2014 to 13.9 % cover in 2018, representing a gain of 0.6 percentage points.
The extent of vegetation data coverage is different for 2014 and 2018. Coverage was limited to State Government acquired aerial imagery, which is the primary data required for the Urban Monitor approach. Data covering approximately 674,000 ha was available for 2018, however a smaller area of coverage was available for 2014. The 2014-2018 tree canopy cover comparison figures are based on 2018 data which has been clipped to the 2014 data coverage area.
Source: Hurley, J, Saunders, A, Both, A, Sun, C, Boruff, B, Duncan, J, Amati, M & Caccetta, P 2019, Urban Vegetation Cover Change in Melbourne 2014 - 2018, Clean Air and Urban Landscapes Hub, Melbourne.
2018 urban heat
Urban heat island (UHI) is a measure of the deviation of urban temperatures above or below a non-urban baseline temperature.
Find out more about UHI.
The average UHI reading of small statistical areas (Mesh Blocks) within the study area varied from 10.20 °C to -7.16 °C.
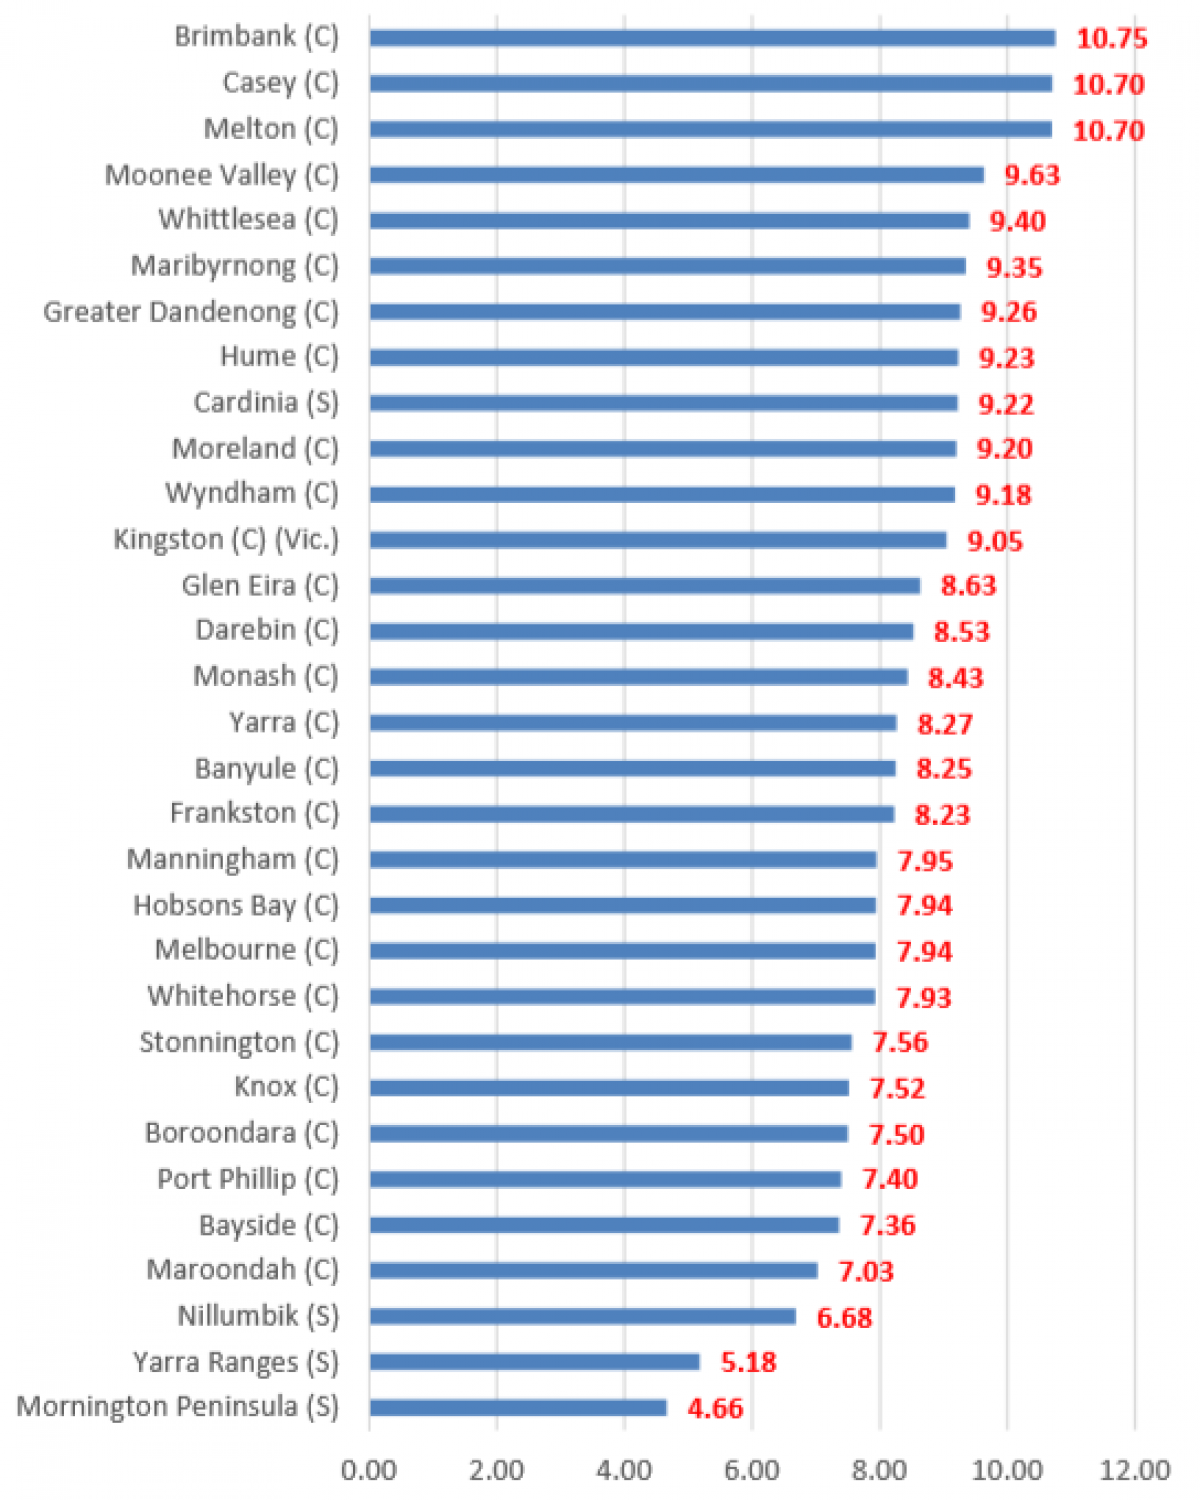
Brimbank, Casey, Melton, and Moonee Valley LGAs have an average summer UHI reading over 9.5 °C.
All urban LGAs had an average summer UHI reading over 7.0 °C, except:
- Mornington Peninsula
- Yarra Ranges
- Nillumbik
Large UHI concentration areas appeared in the western and south eastern suburbs of metropolitan Melbourne, along with some scattered areas of high UHI readings in the northern suburbs. Lower UHI concentration areas were mainly along the coast, eastern and north eastern suburbs, and in highly vegetated areas.
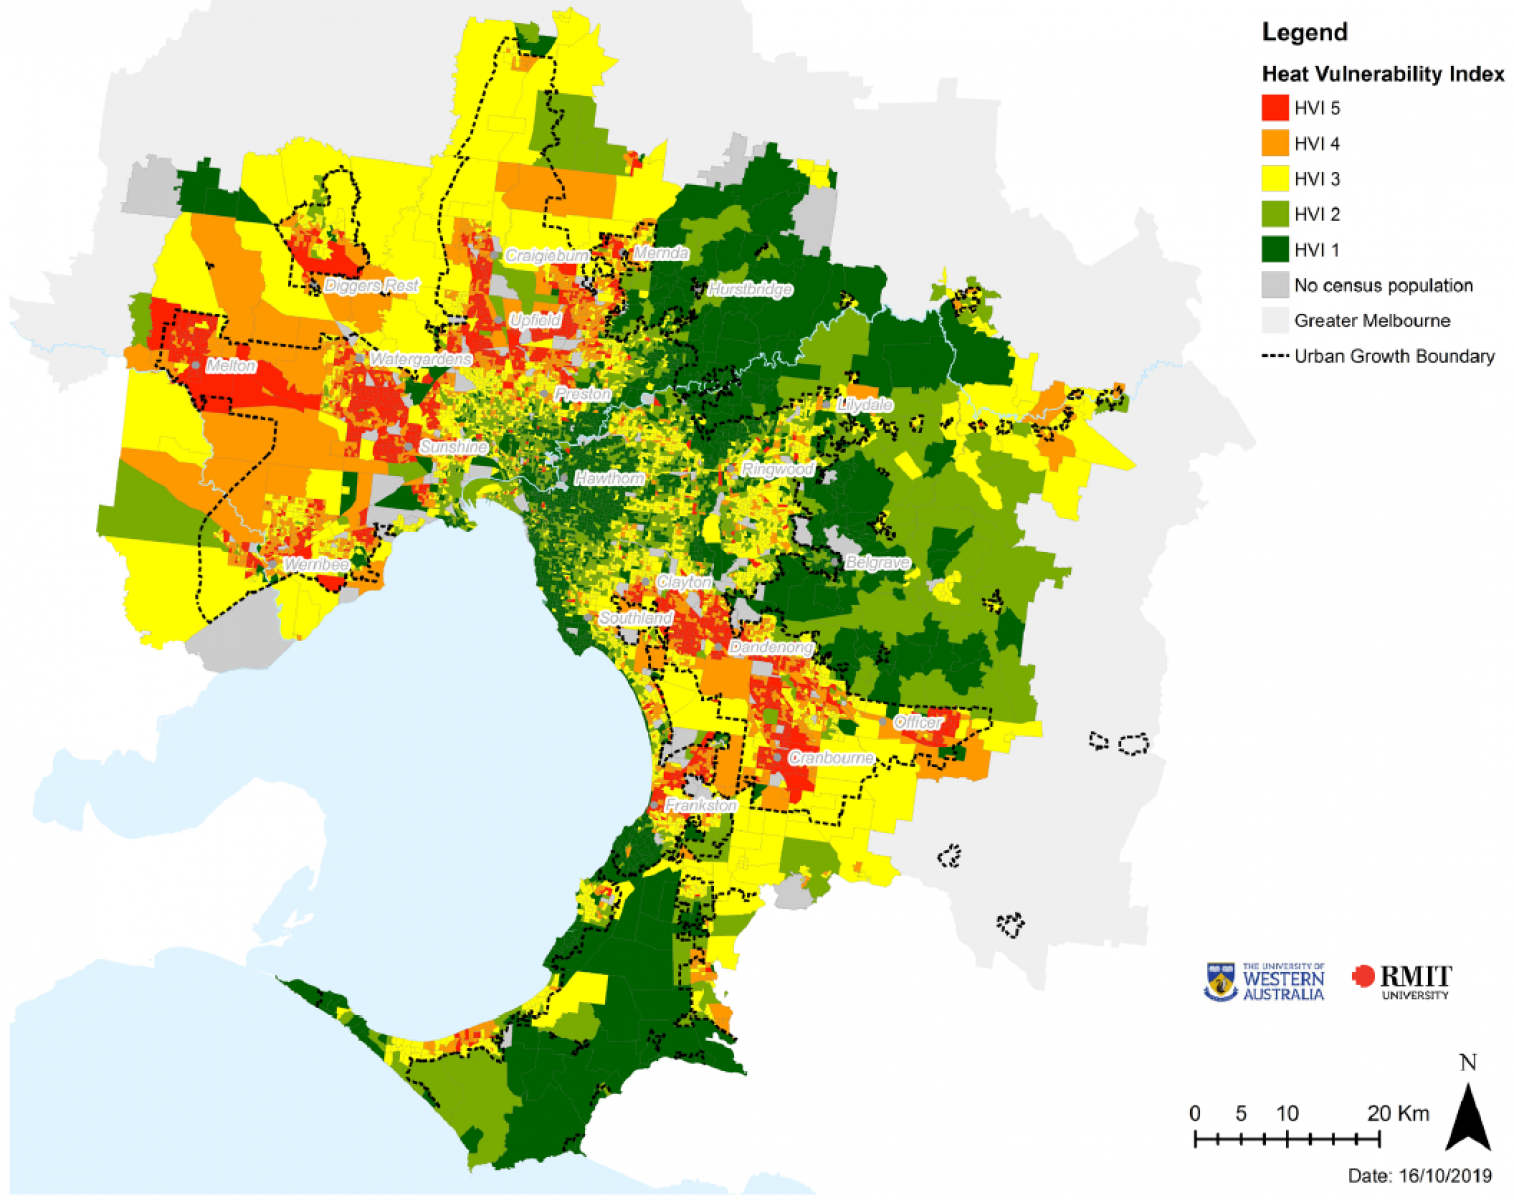
2018 heat vulnerability index
Heat vulnerability index (HVI) identifies which populations are most vulnerable to heat. Find out more about HVI.
High-risk areas with a HVI rating of 5 were mainly distributed in the LGAs of:
- Melton
- Brimbank
- Darebin
- Casey
- Wyndham.
HVI ratings in some areas were high despite lower UHI readings, due to the concentration of vulnerable members of the community, such as the elderly, very young and those with lower capacity to adapt to heat.
The impacts of urban heat are reduced in LGAs with low social vulnerability, which typically have a low proportion of younger or older people and/or higher levels of socioeconomic development, for example Nillumbik and some parts of Manningham.
By contrast, high social vulnerability intensifies heat health risks as people are less able to adapt, for example in Brimbank, Casey and Melton.
The 2014 and 2018 temperature readings are not directly compared.
Source: Sun, C, Hurley, J, Amati, M, Arundel, J, Saunders, A, Boruff, B & Caccetta, P 2019, Urban Vegetation, Urban Heat Islands and Heat Vulnerability Assessment in Melbourne, 2018, Clean Air and Urban Landscapes Hub, Melbourne, Australia.
Relationship between UHI and vegetation
Tree canopy cover was found to have the strongest relationship with reducing heat in urban areas. By comparison, there was less evidence to suggest that grass and shrub cover has a large influence in reducing urban heat.
Source: Sun, C, Hurley, J, Amati, M, Arundel, J, Saunders, A, Boruff, B & Caccetta, P 2019, Urban Vegetation, Urban Heat Islands and Heat Vulnerability Assessment in Melbourne, 2018, Clean Air and Urban Landscapes Hub, Melbourne, Australia.
Why measure and monitor our urban forest?
Vegetation mapping is done locally in many different ways which makes it difficult to have a clear picture of vegetation cover at a metropolitan scale and at a high enough resolution for local decision making.
Key benefits of improved mapping and monitoring include:
- enabling evidence based planning and decision making for urban forests
- informing greening targets and tracking progress
- assisting with identifying priority areas for action and investment
- providing a resource for local government to develop local greening strategies, and
- providing a baseline for monitoring the implementation of greening strategies and regulatory responses.
Page last updated: 25/10/23