VicPlan is a state wide map viewer for location based planning scheme information. You can use it to locate any property or parcel in Victoria using the address/parcel search, or by browsing on the map. You can also access direct links to the planning rules for a site in the planning scheme.
From VicPlan you can create a Planning property or parcel report with localised maps showing the zone and overlays. You can also access VicPlan via the maps in planning schemes.
the area will highlight on the map and details will be displayed in an information panel next to the map.
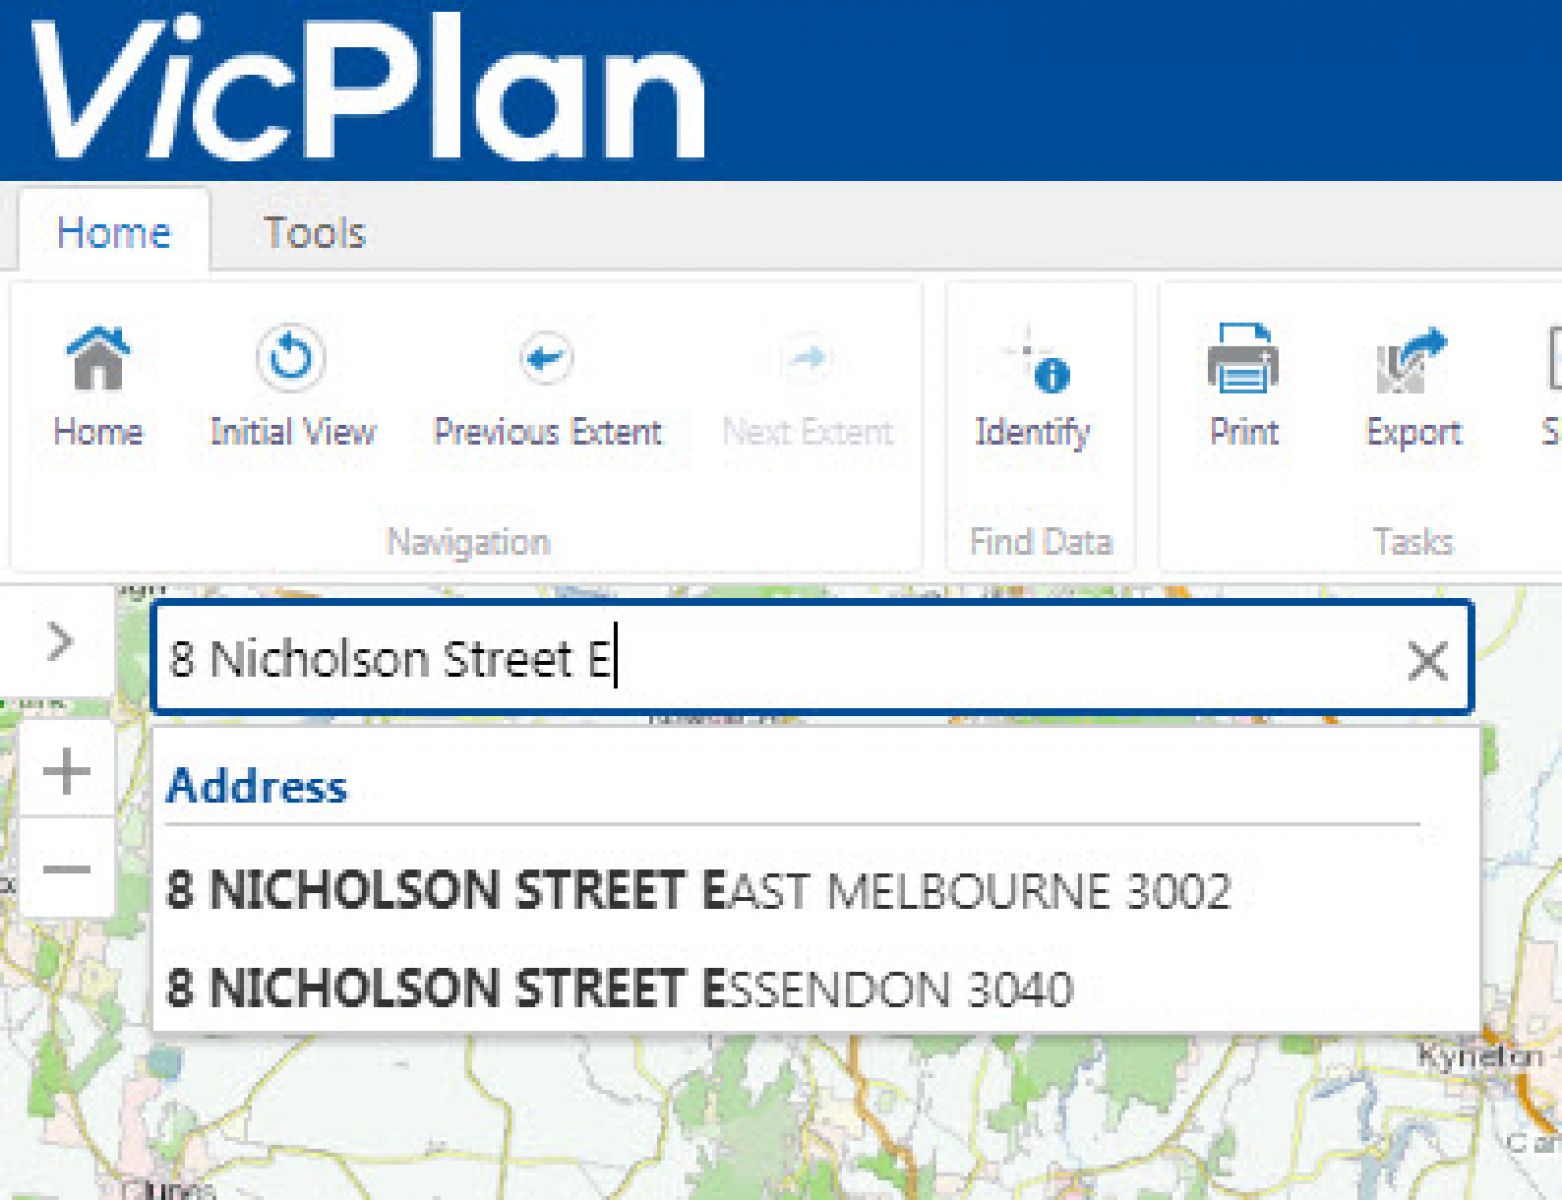
If you don't see options in the suggestion list, either type more of the address or alter the details entered slightly to change the suggestions. Only the top 5 results are shown.
Type enough of the address to make it distinguishable from similar addresses. You can use abbreviations, for example St for Street.
VicPlan address search
You can search in VicPlan by:
Search type
Example
Address
21 Smith Avenue Thomastown 3074
Parcel or lot on plan
7\RP4959
Parcel property number
P204293
Property LGA number
124207
Lot on street
Lot 1 Smith Avenue Croydon
Street
Smith Street Albert Park
Locality
Albert Park
Postcode
3181
Parish
Moorpanyal
Local Government Area
Bayside
Heritage Inventory Site name
Royal Park Hospital Precinct
Heritage Inventory Number
H7822-0436
Heritage Register Number
H1926
Heritage Register Site Name
Braille Library & Hall
Heritage Inventory Hermes Number
13925
Heritage Register Hermes Number
11566
Crown Land: use combination of Allot, Sec, Sub, Por, Blk with Parish name
Parish Ararat Allot 1 Sec 15A
Some search types require a certain format – refer to the examples in the list.
A parcel an individual piece of land that can be sold separately, and is also known as a lot. It usually has one proprietor or owner. An example of a parcel descriptor is 1\LP23402.
A property is land, typically identified by a street address or a rate assessment number, that is under common occupation for the purpose of rating, billing or habitation. A property can be made up of one parcel or contain many parcels, or be one part of a parcel or parcels. An example of a property address is 23 Diamond Avenue Glen Waverley 3150.
When searching for a parcel or lot on plan number, use a backslash: '\'. VicPlan uses the standard parcel identifier number, which is the lot and plan numbers separated by a backslash.
If you don’t have a search term, browse the map by:
select and dragging the map to a location
zoom in or out to see more or less detail
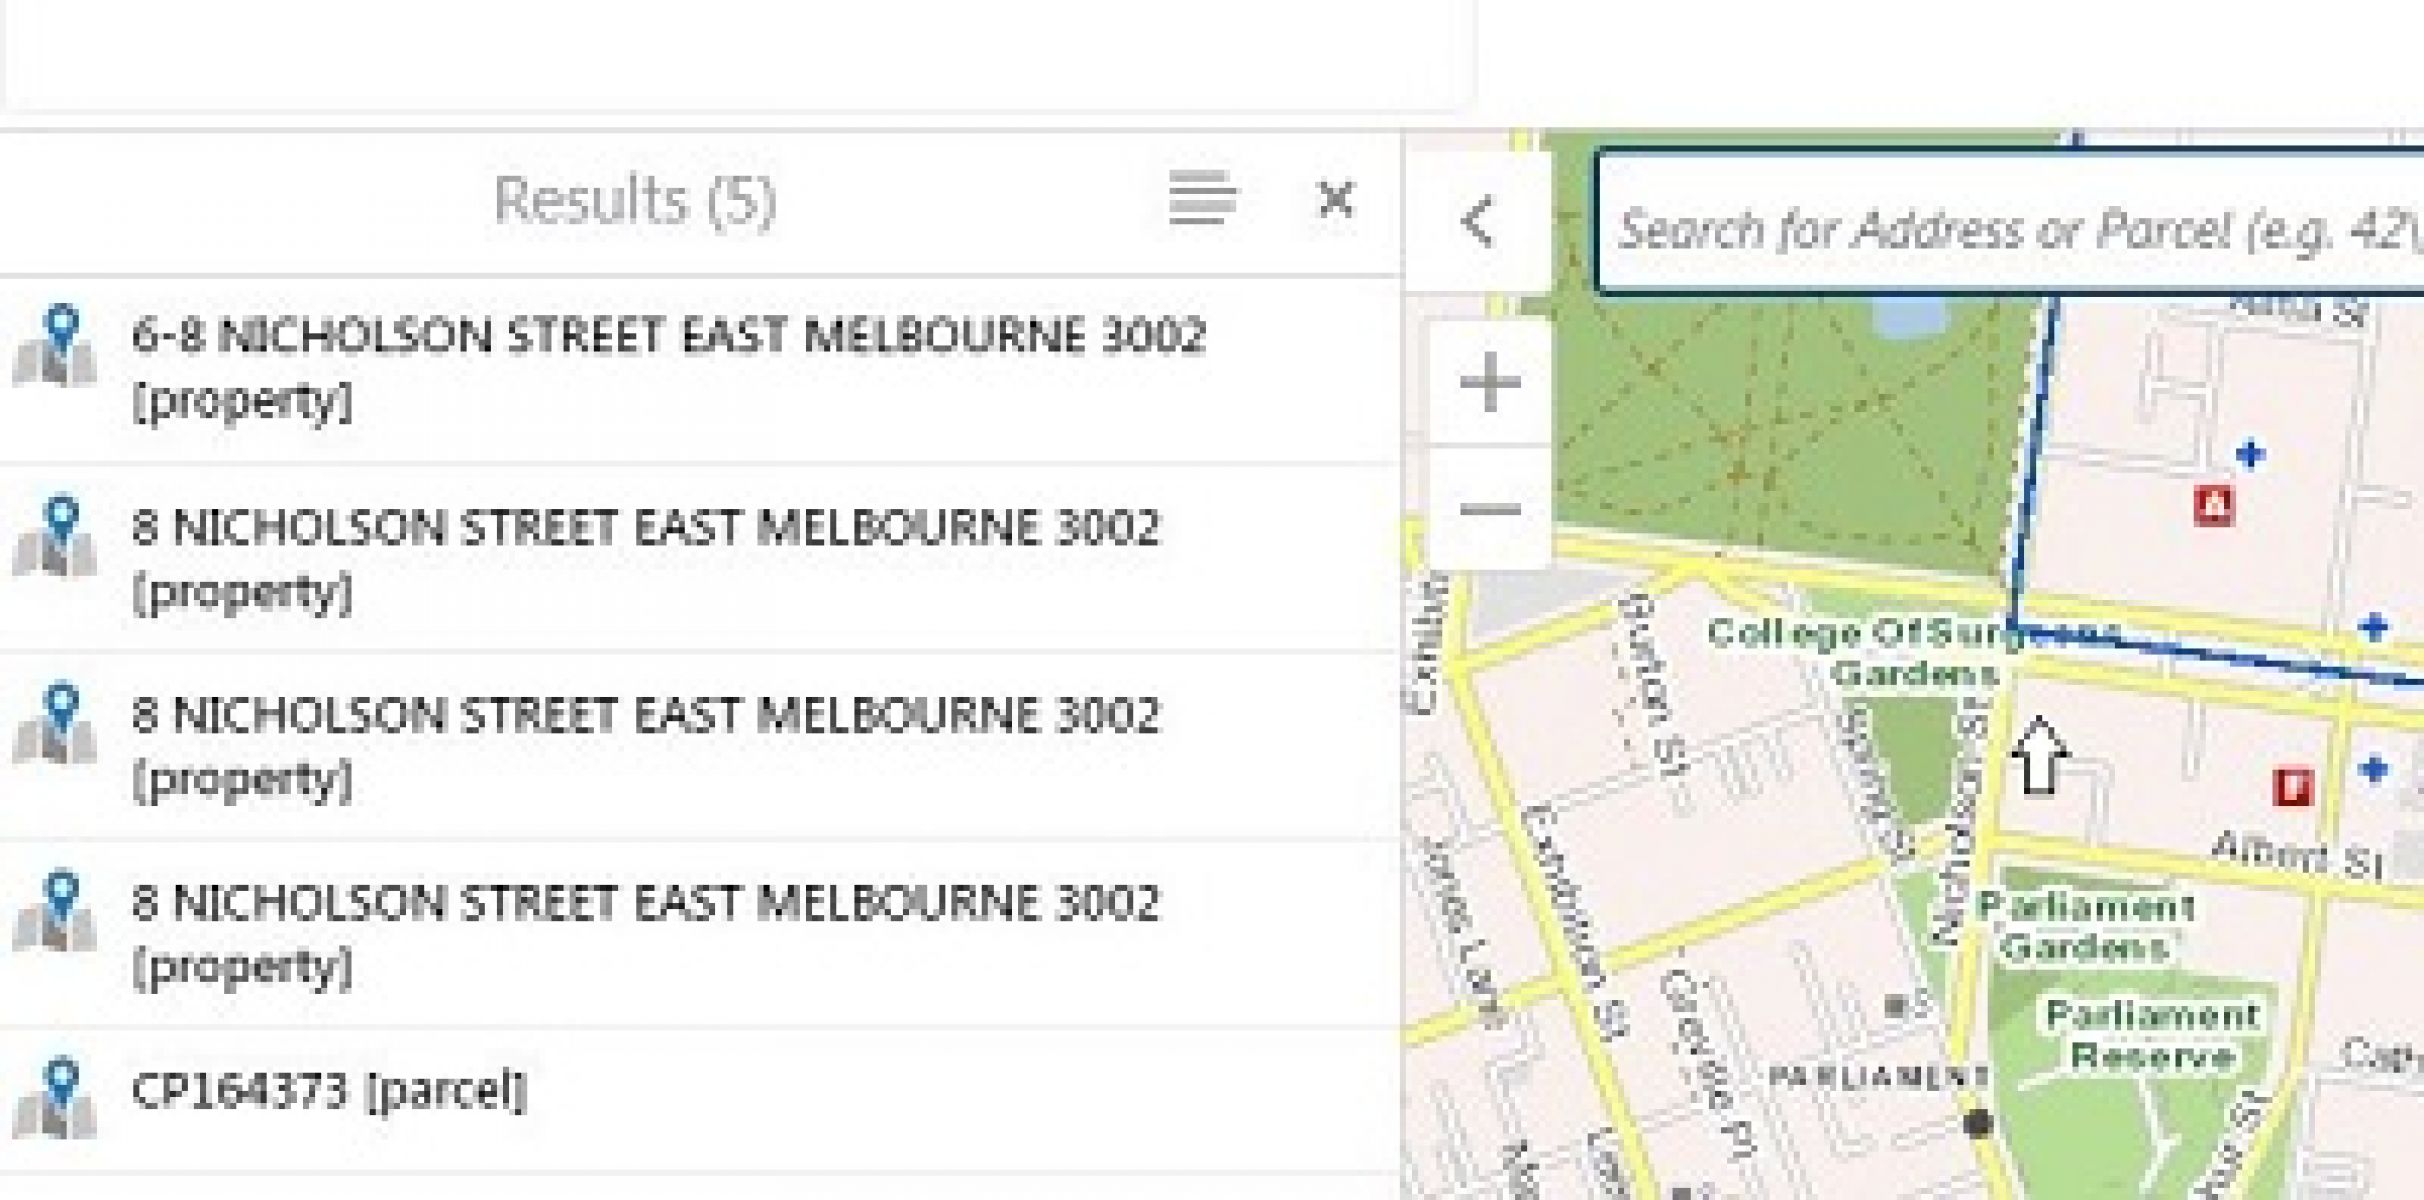
select a location to see a list of property and parcel options in the information panel next to the map
choose an option from the list – that location will be centred in the map and details displayed in the information panel.
VicPlan browse map
Selecting a property or parcel
You can only click on a location when zones and overlays are visible – at a scale of 1:25,000 or lower.
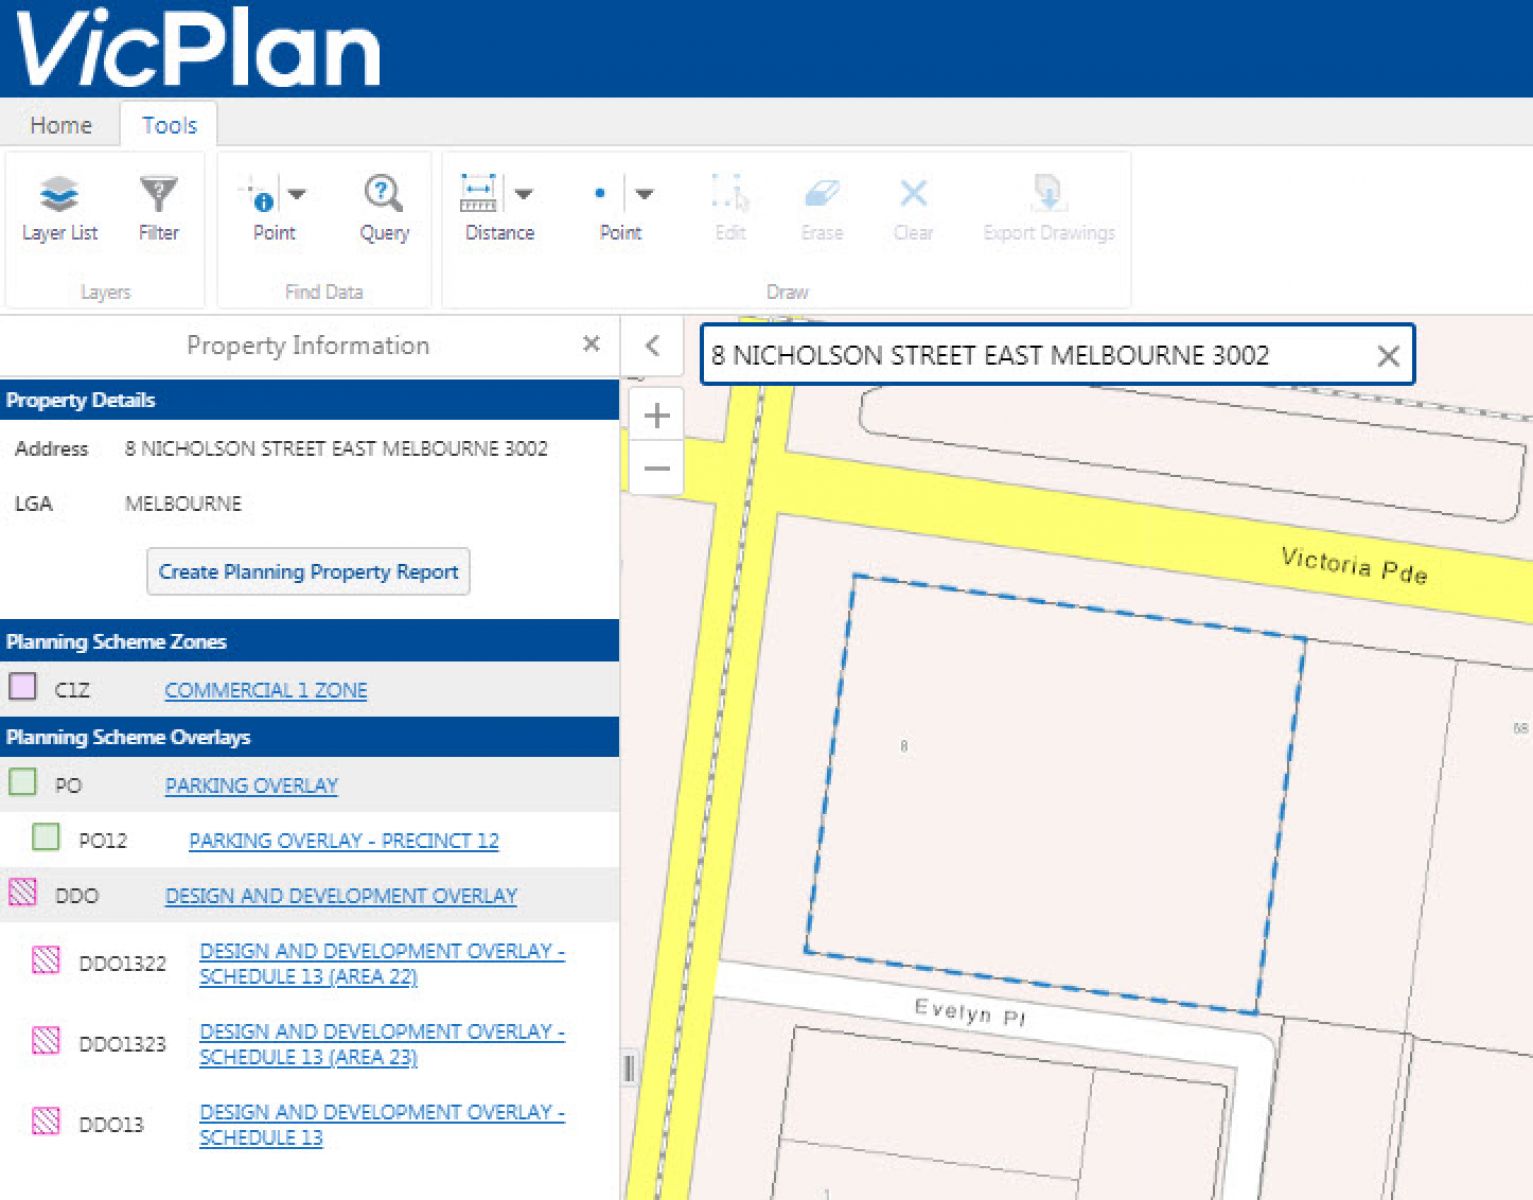
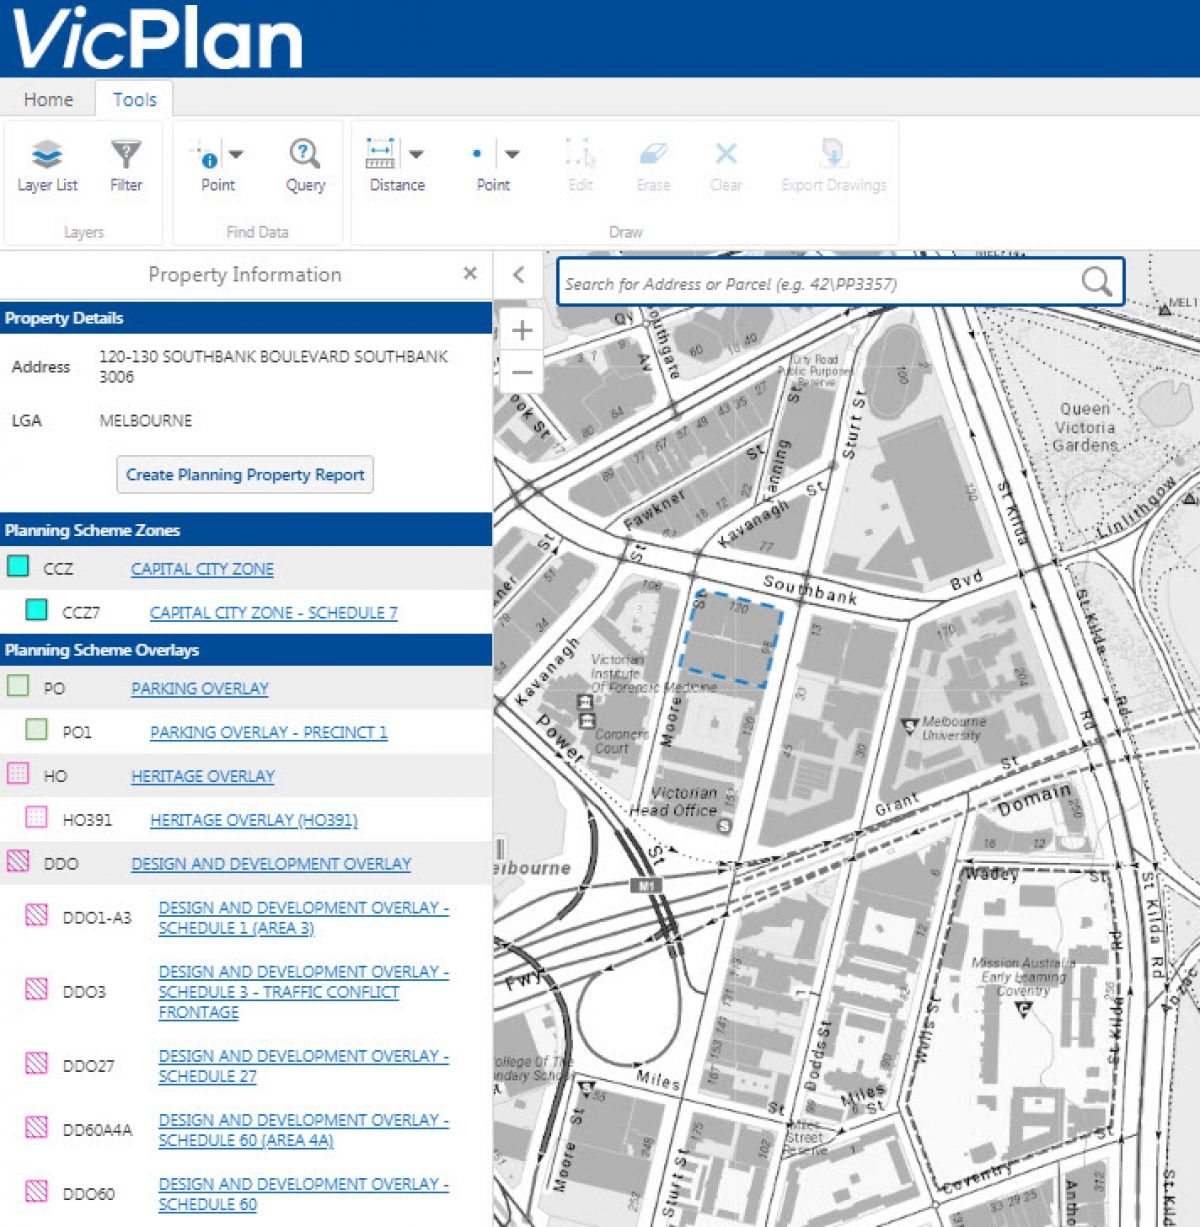
Select a site to bring up property and parcel options in the property information panel. Links to the local planning scheme for each zone and overlay appear in the property information panel.
Selecting a property or parcel in VicPlan
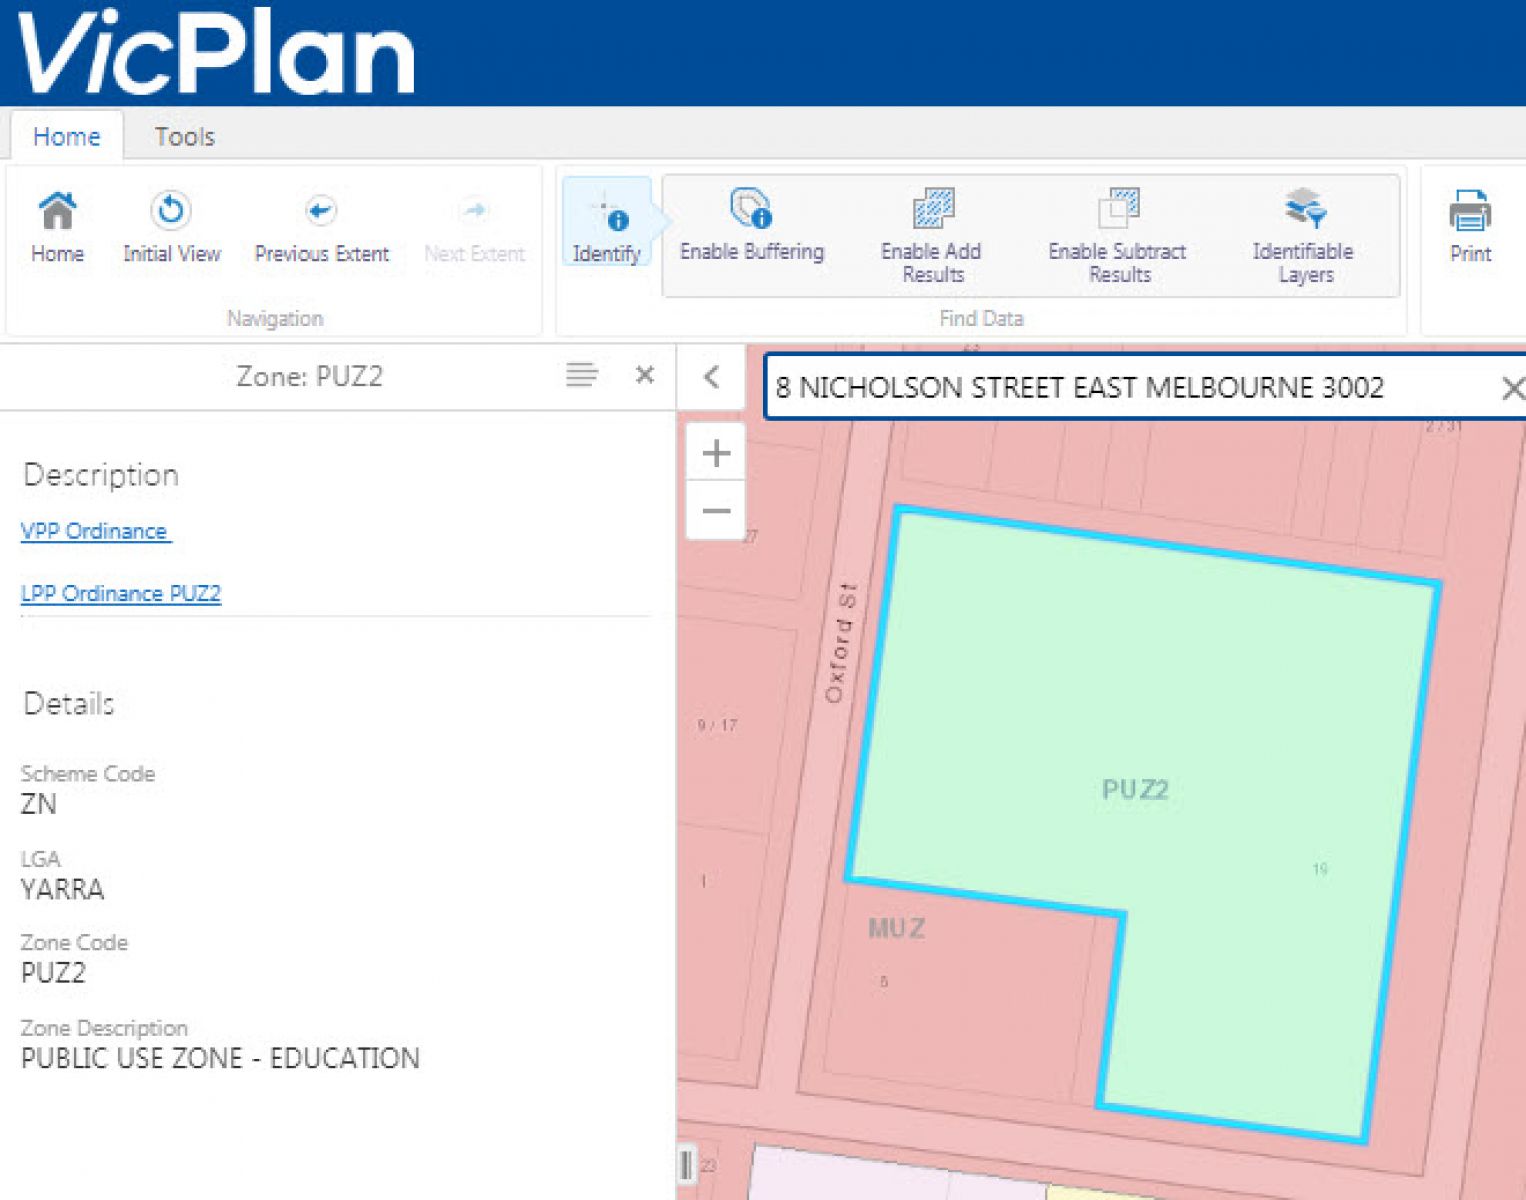
To get more information about a selected property or location, use the ‘Identify’ button. Identify displays the zones, overlay or LGA layer, and the property information panel provides a selection based on the information in the selected point.
Right click on a location in the map to ‘Find data on the map’ to retrieve similar data, including the latitude and longitude coordinate.
Use Identify to see more information about a property or parcel
Download a planning property or parcel report
A planning property report is a download that contains all the zone and overlay information for the selected property or parcel, and a series of maps with links to sections of the local planning scheme.
To download a property report:
search for and select a property or parcel (see above)
on the property information panel, select 'Create planning property report'.
A planning property report can not be generated on proposed properties or parcels. These display as black hatching and cross hatching on the map.
Select a property or parcel and generate a planning property report
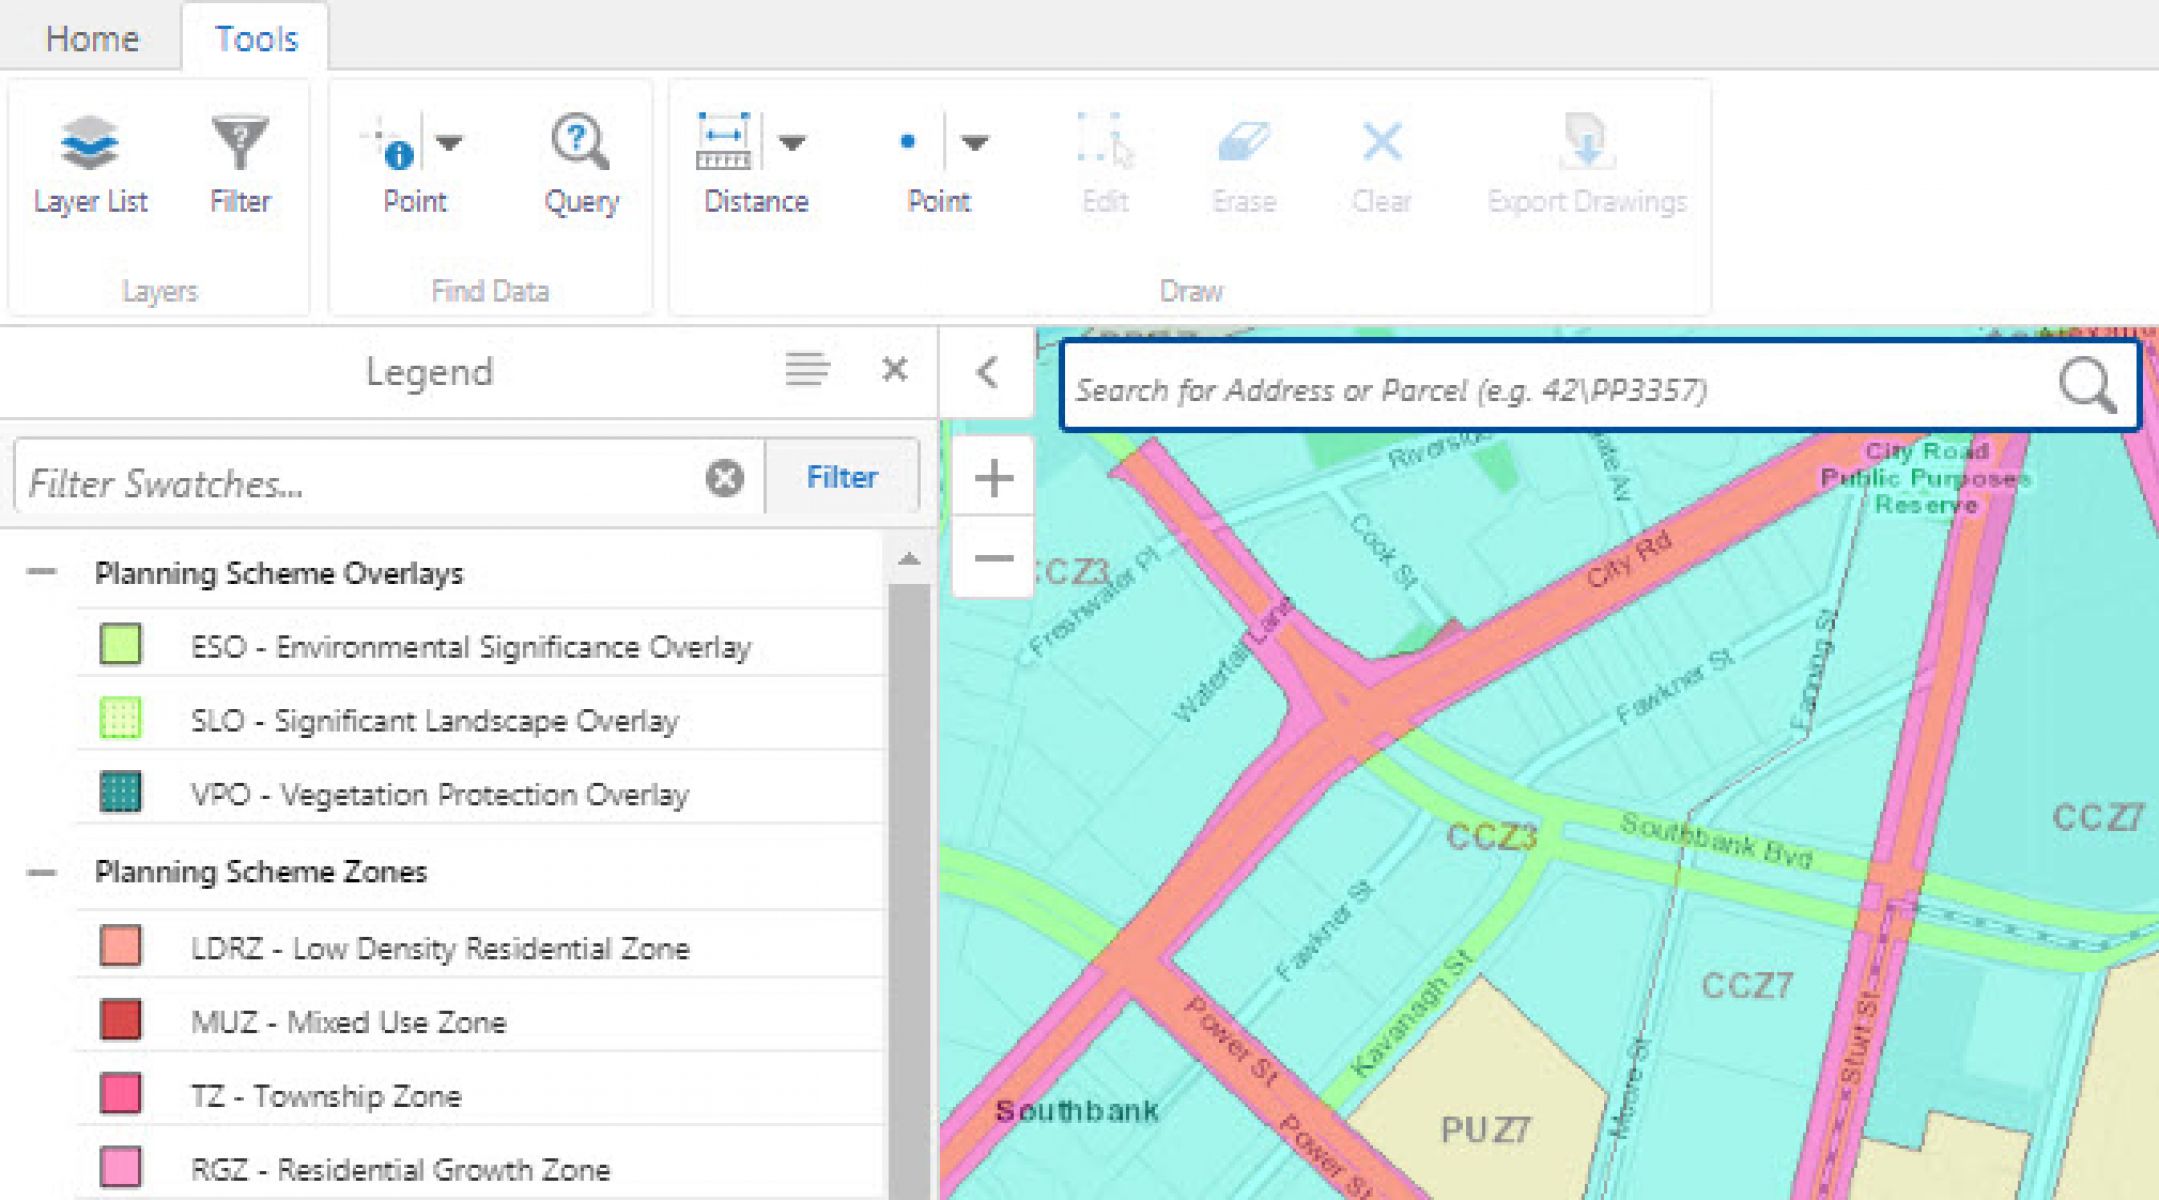
Zones and overlays
Zones and overlays are only visible at a scale view of 1:25,000 or lower. Zoom in to see them.
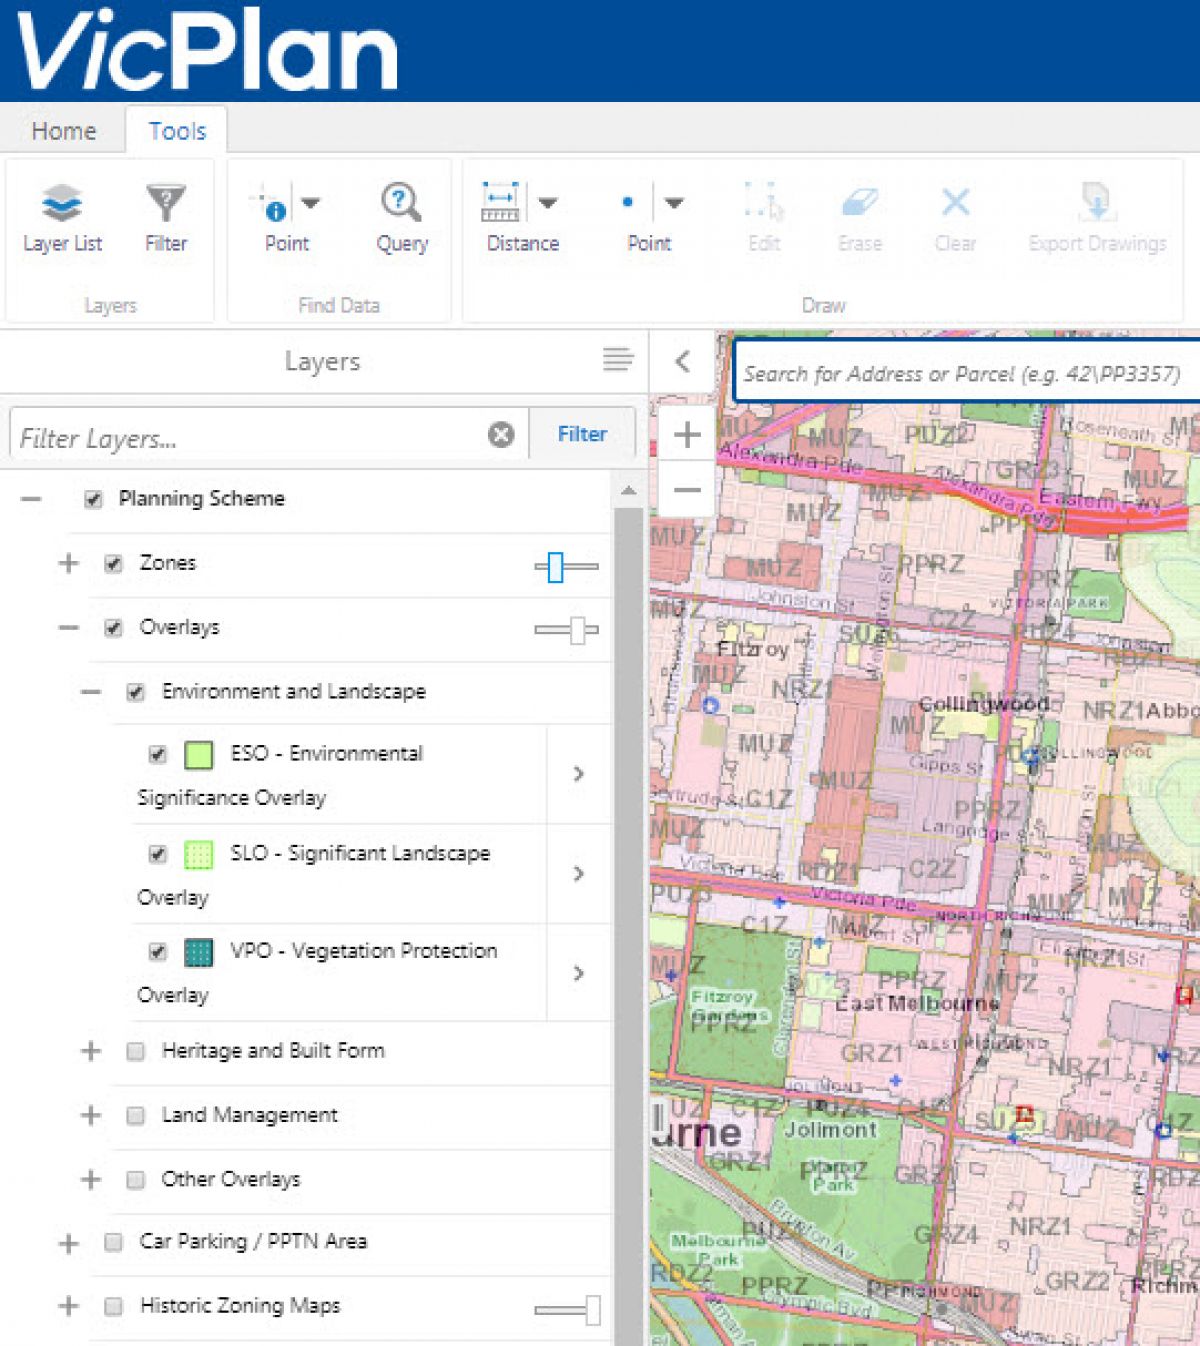
Each planning zone and overlay can be selected by clicking the 'Layer list' in the toolbar or the 'Layers' menu in the property information panel.
If you are unable to find the zone or overlay you want to turn on or off, use the 'Filter' search bar in the 'Layer list' to change the colour transparency.
The toolbar buttons and 'Layer list' update visible zones and overlays for the entire state so you can zoom in and out with zone and overlays selected.
Zones or overlays do not default back to the original view after you have made your selection. Reselect the layers that have been turned off to return to the default view.
Selecting individual layers or zones
Zone and overlay codes
Every planning scheme zone and overlay control has a unique code that is a combination of colour, text and numbers.
Tthe property information panel shows the planning scheme zone or overlay, its colour on the map, the zone code and its corresponding ordinance documentation.
Planning scheme zones and overlays in the property information panel
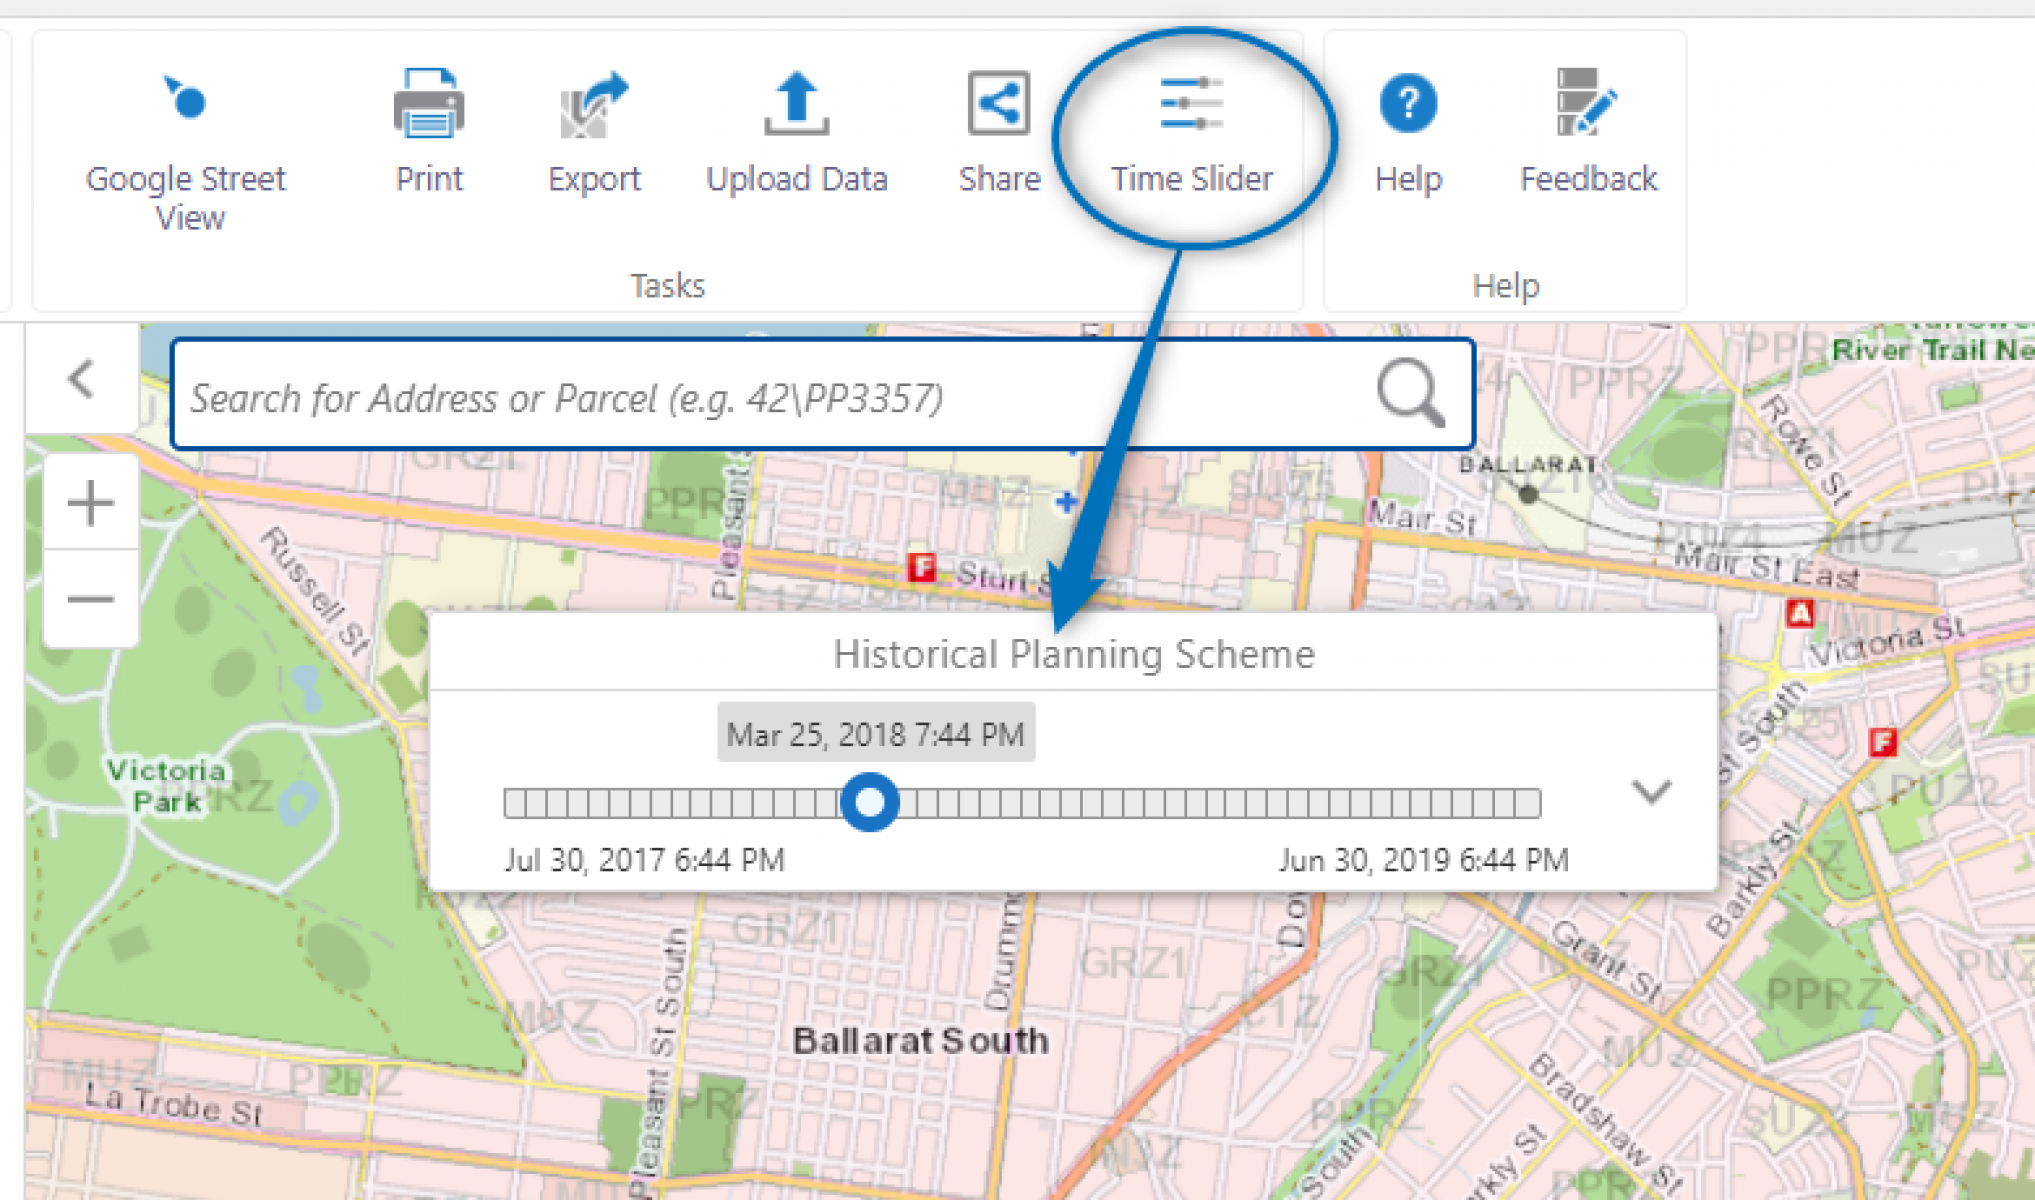
View historical zones, overlays or property boundaries
To view historic planning scheme zones, overlays, amendments and associated property boundaries:
locate the property on the map
go to the layer control panel
turn off the current planning scheme and property layers and turn on the historic planning scheme and historic property layers
select the time slider tool
change the slider to a different point in time
if there have been changes, the map will change according to the date on the slider.
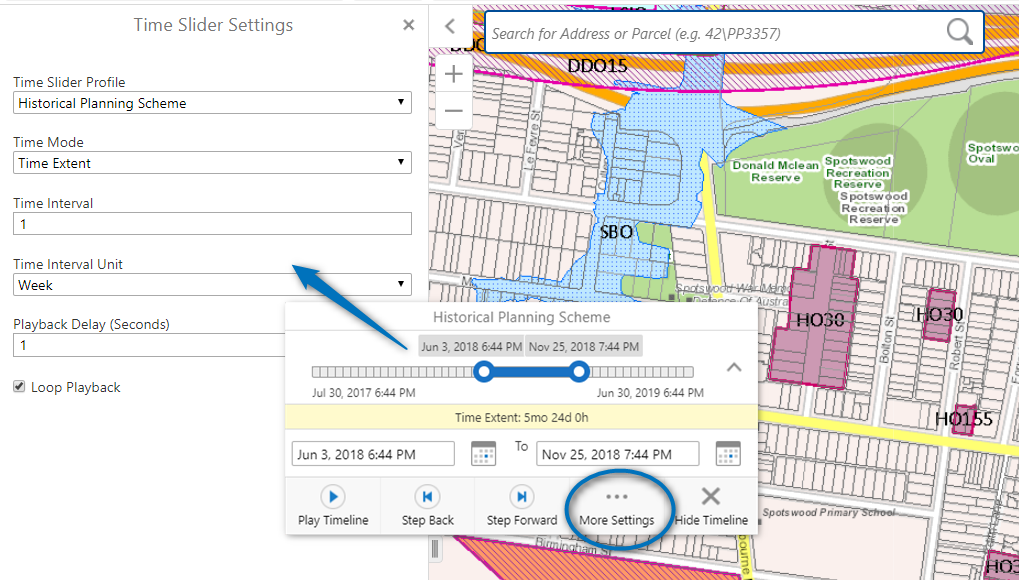
View the map using a time range by changing the 'Time mode' in the time slider 'More settings' option. This allows you to view from date 1 to date 2, instead of a single point in time.
You can step forward and backward or play a timeline to animate changes over time.
View changes over time using the Time slider settings
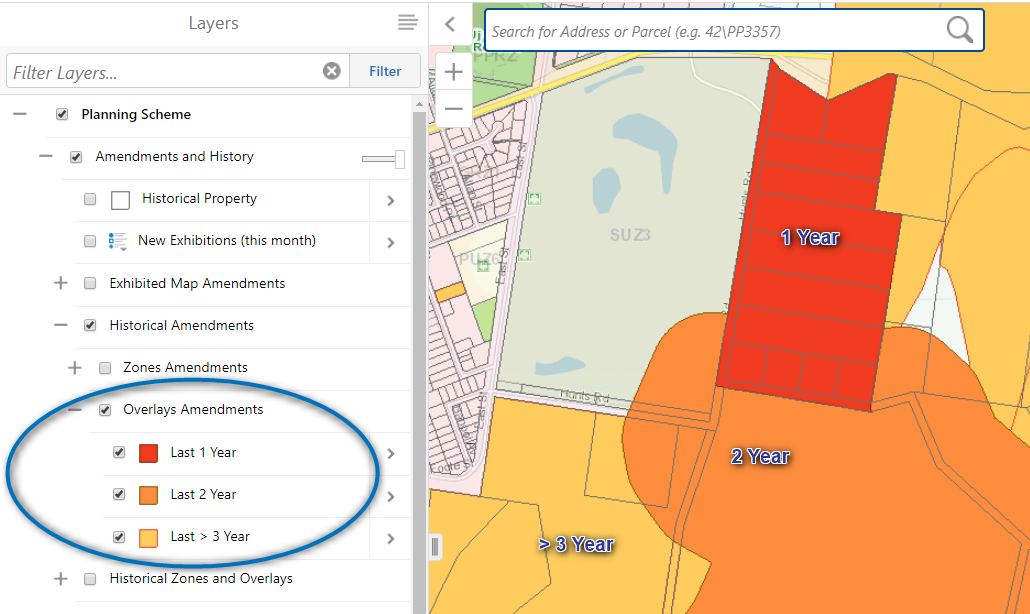
Historic planning scheme amendments will display 3 years of zone and overlay changes.
To view:
go to the layer control panel
expand the 'Historical amendments' option
turn on either 'Zone amendments' or 'Overlay amendments'.
This will display the last 3 years of amendments colour coded.
VicPlan also provides access to Historic Zoning Maps from 1954, 1959, 1968 and 1985. These layers are available under the planning scheme folder under 'Historic Zoning Maps'.
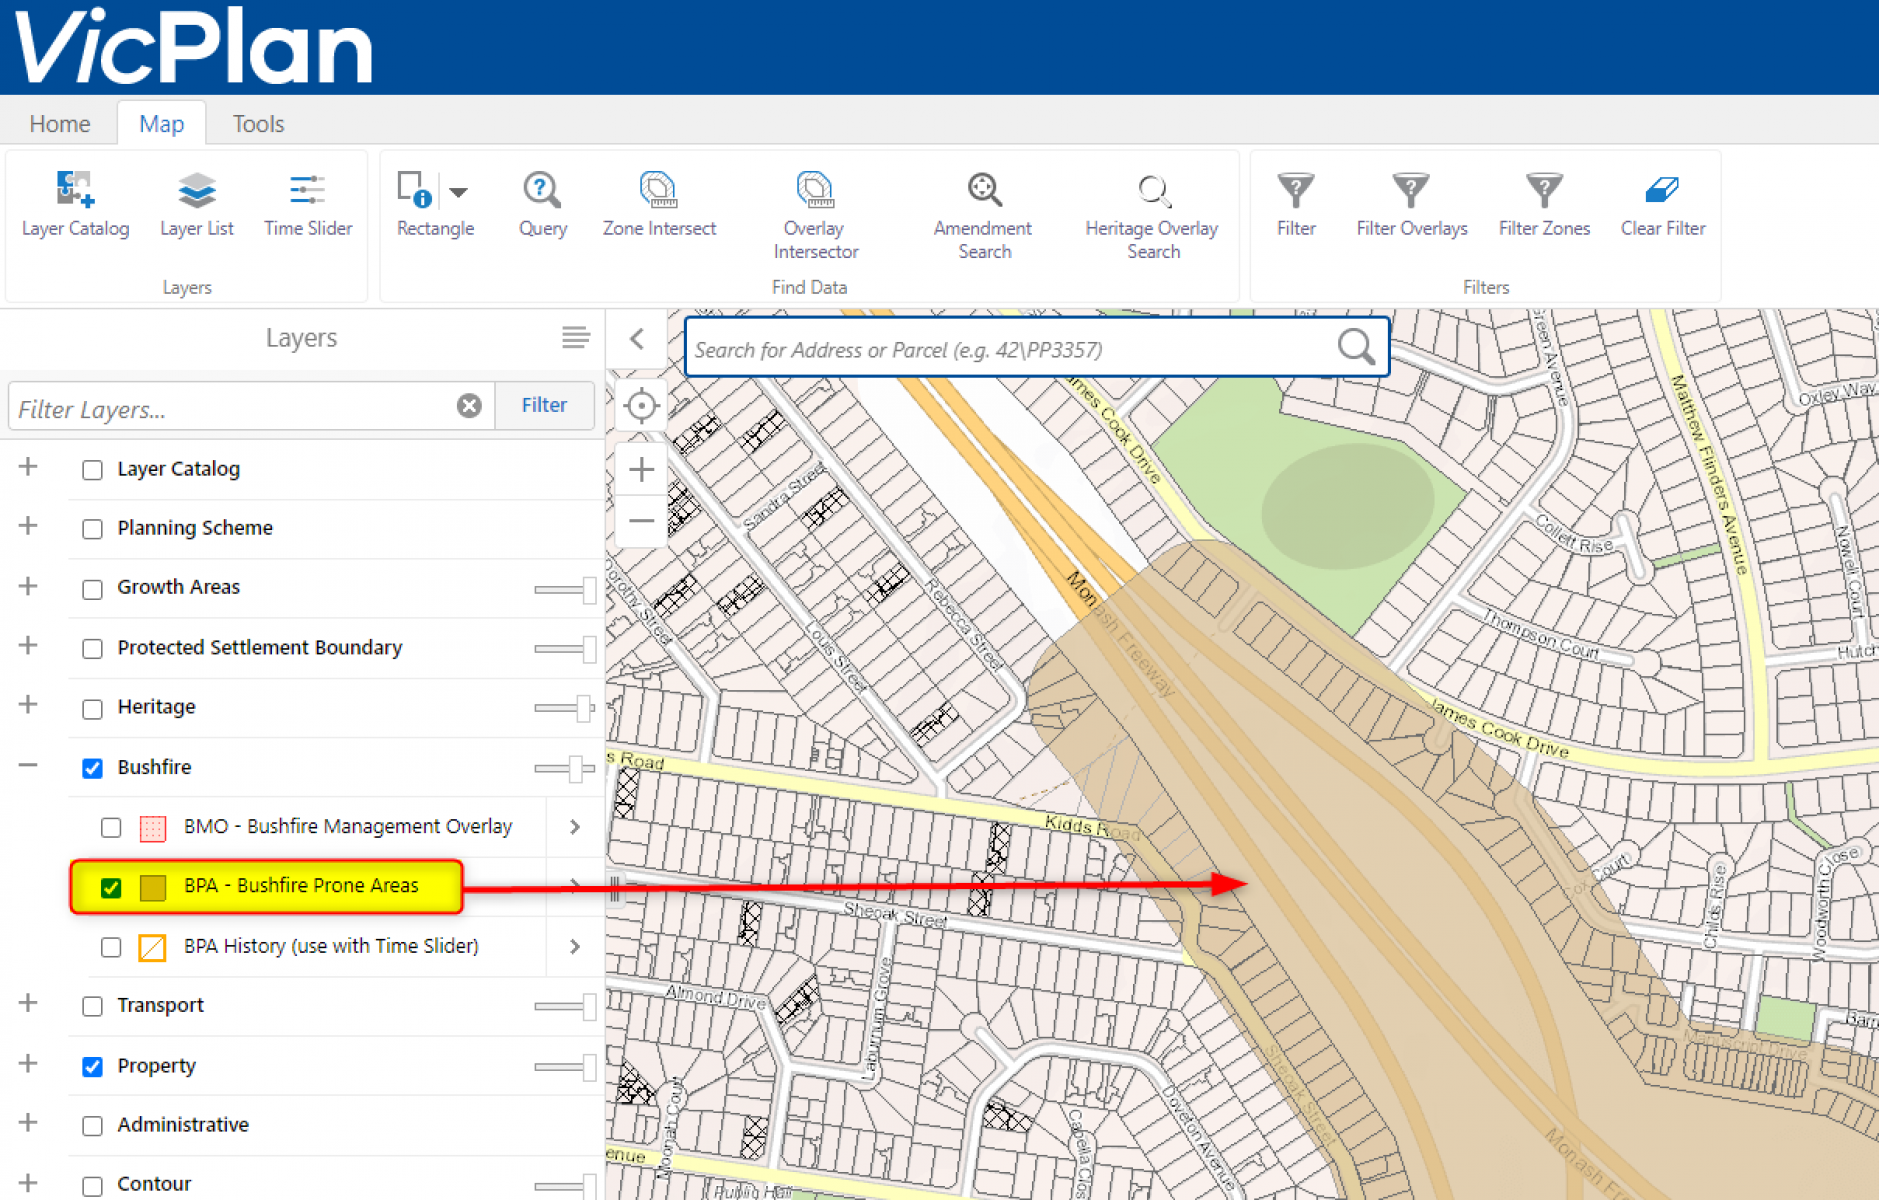
Bushfire prone areas and the Bushfire Management Overlay
There are 2 ways find out whether bushfire controls apply to your property.
Create a planning property report – the report contains bushfire controls that may affect your property:
the Bushfire Management Overlay (BMO) in the planning overlays section
Bushfire prone area (BPA) in the designated bushfire prone areas section.
View the map – locate the property on the map and open the layers menu at the bottom left of the screen:
Uncheck the Planning scheme folder
Scroll to the Bushfire folder, expand the menu and select it to turn on the layer in the map
If BMO and BPA layers exist in your area they will be displayed on the map.
Bushfire controls apply if the BMO or BPA layers intersect your property.
A typical view of the bushfire prone area layer and property boundaries.
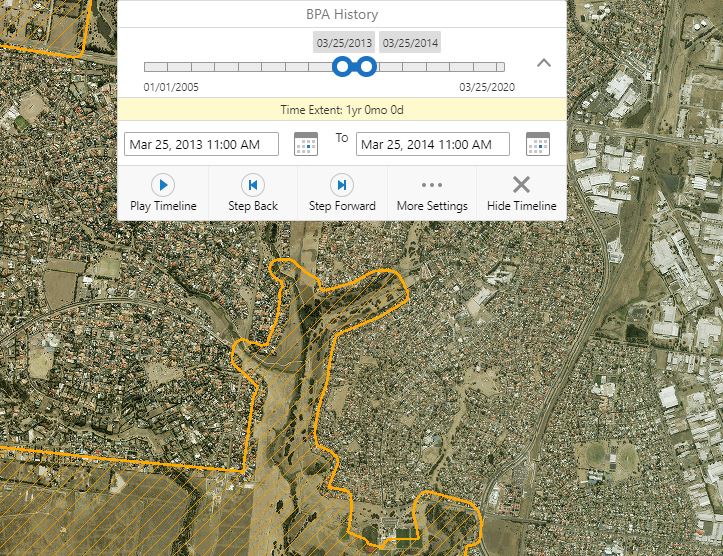
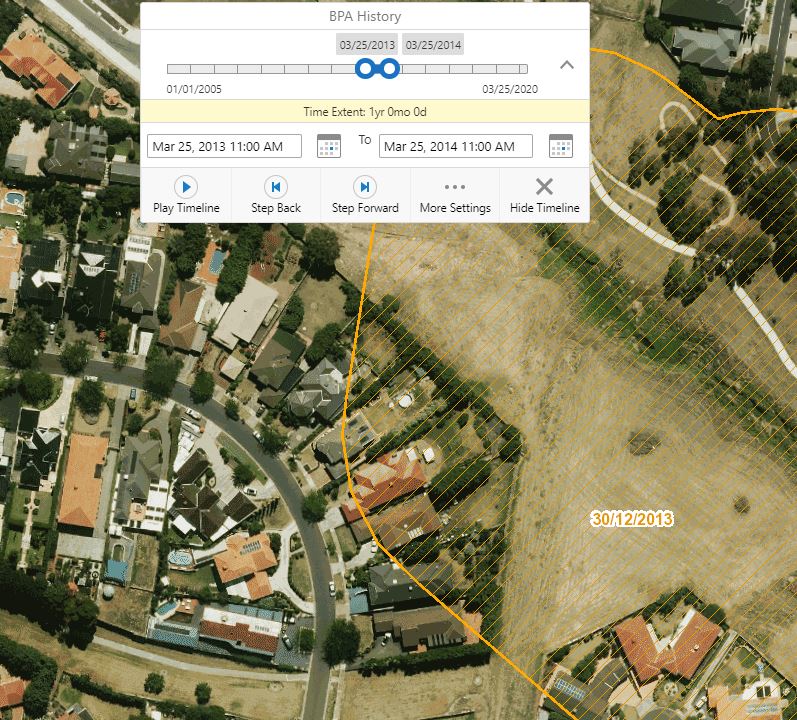
The BPA history layer is located in the Bushfire folder in the layer control. It contains historic bushfire prone areas from 2005.
To view historic layers:
go to an area of interest and zoom in or set the map scale within 1:100,000
turn on the 'BPA History' layer
select the 'Time slider' button on the main toolbar above the map and expand the options
select 'More settings' and change the Time Slider Profile to 'BPA History'
the BPA History layer will display on the map and you can step forward or back on the slider to view the BPA at different points in time.
Bushfire prone area in 2013-2014.
Specific dates are stored in each polygon as attributes and displayed on the map when zoomed into 1:1,250 map scale.
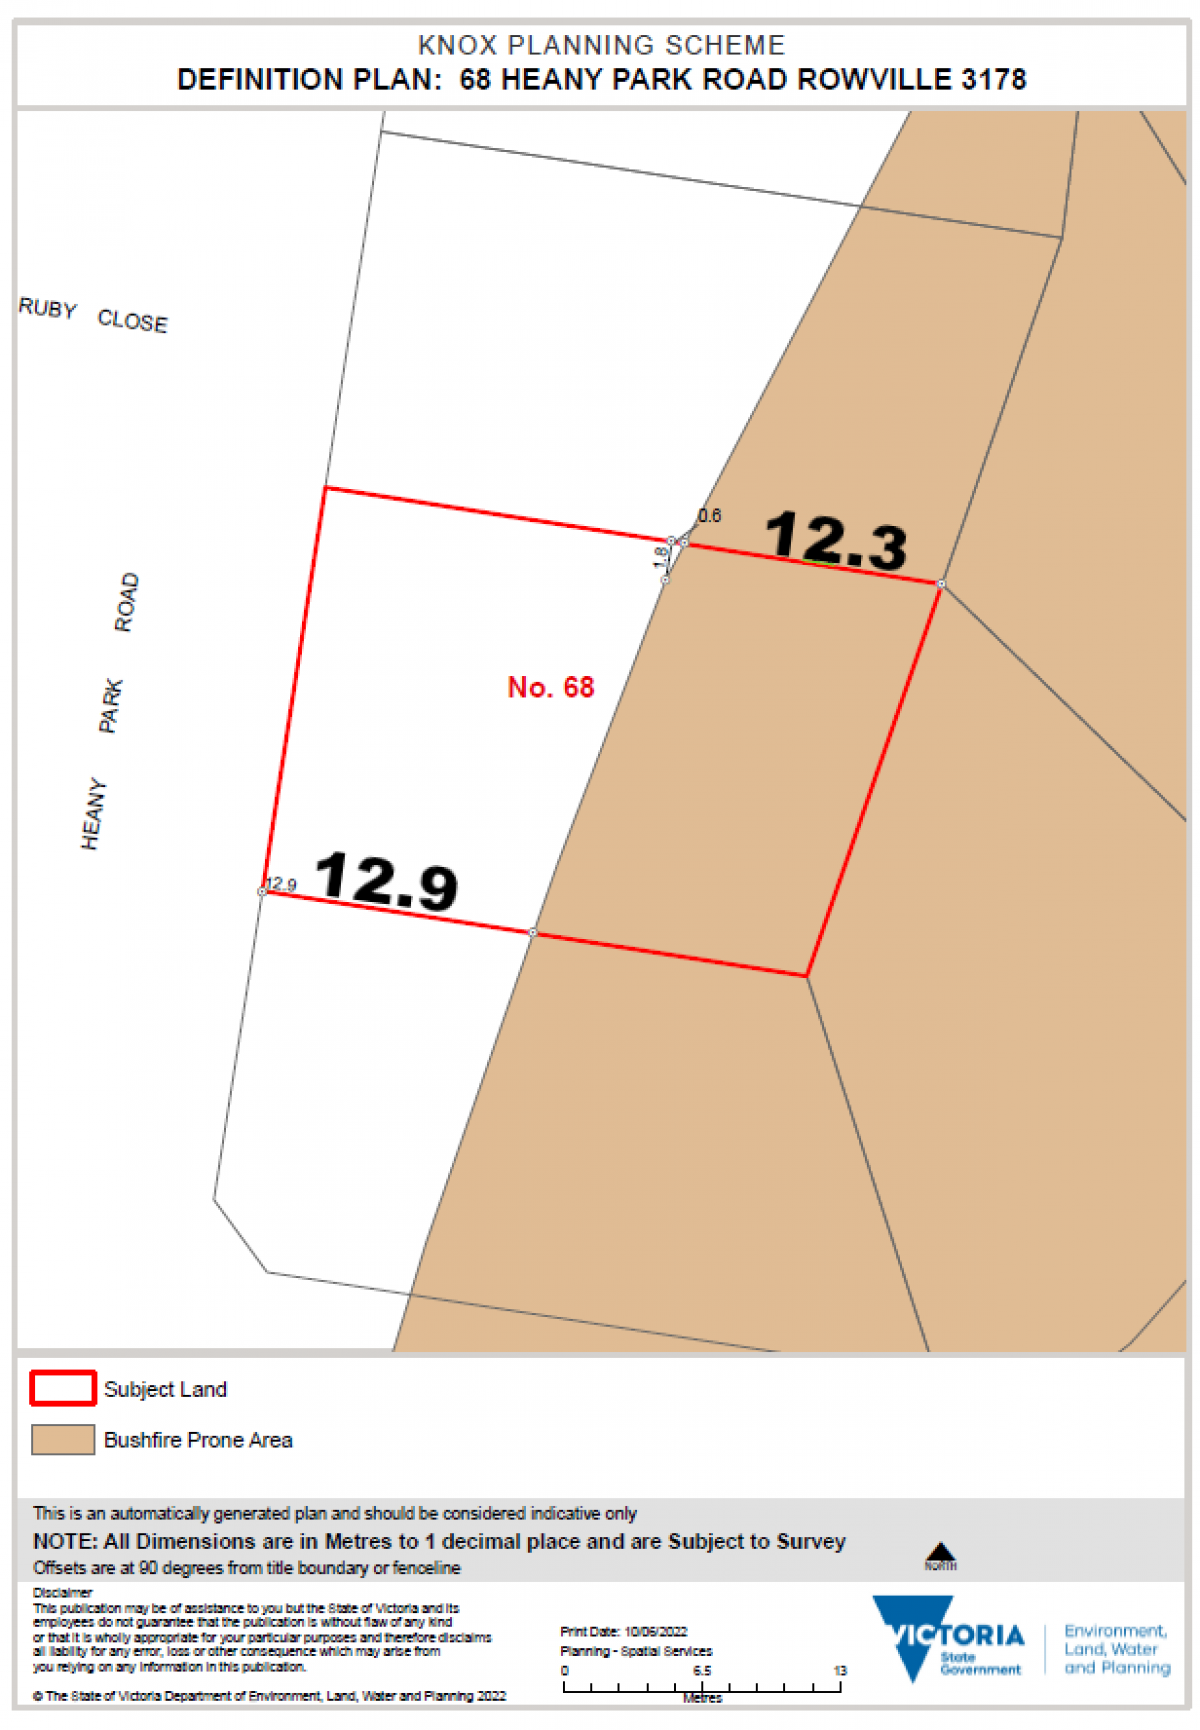
Create a definition plan
A definition plan is a diagram for a property showing the location of planning zones, overlays and bushfire prone areas when they do not cover the entire property or parcel title boundary. The plans show the distance between the zone, overlays or BPA boundaries and the selected property boundaries.
Definition plans are available for properties that are partially impacted by a zone, overlay or BPA. Definition plans can not be generated if a property is fully covered or not impacted at all by a zone, overlay or BPA.
select a search type, enter the property or parcel details and search
VicPlan checks if the property is partially covered by a zone, overlay or BPA
If the property is not partially impacted, a notification displays that the plan cannot be generated for that location.
enter your email and submit.
the selected definition plan in PDF format is sent to the nominated email. Emails can take up to 10 minutes to send.
Example BPA definition plan
Mark up and measure on a map
Add points, text, lines or shapes
The mark up tools allow you to place marks or text, highlight and draw on a map. To access mark up:
go to the 'Tools' menu
select the dropdown arrow next to 'Point' on the toolbar to change the type of mark up: points, text, lines or shapes
you can change colours in the styles menu, erase parts or clear the mark up entirely using the options in the toolbar
while the mark up is selected, you can't use other features or zoom or pan the map – de-select the button to turn it off and return to zoom and pan mode.
To save or print a map, go to the 'Home' menu and select ‘Export’.
Measure an area
There are 2 ways to measure areas of features on the map:
1. Auto measure
a. Property measure
right-mouse click over a property on the map and select ‘Get Property Area’
dimensions and the area of the property are displayed on the map
to remove these temporary markups, go to the 'Tools' menu and select 'Clear'.
or
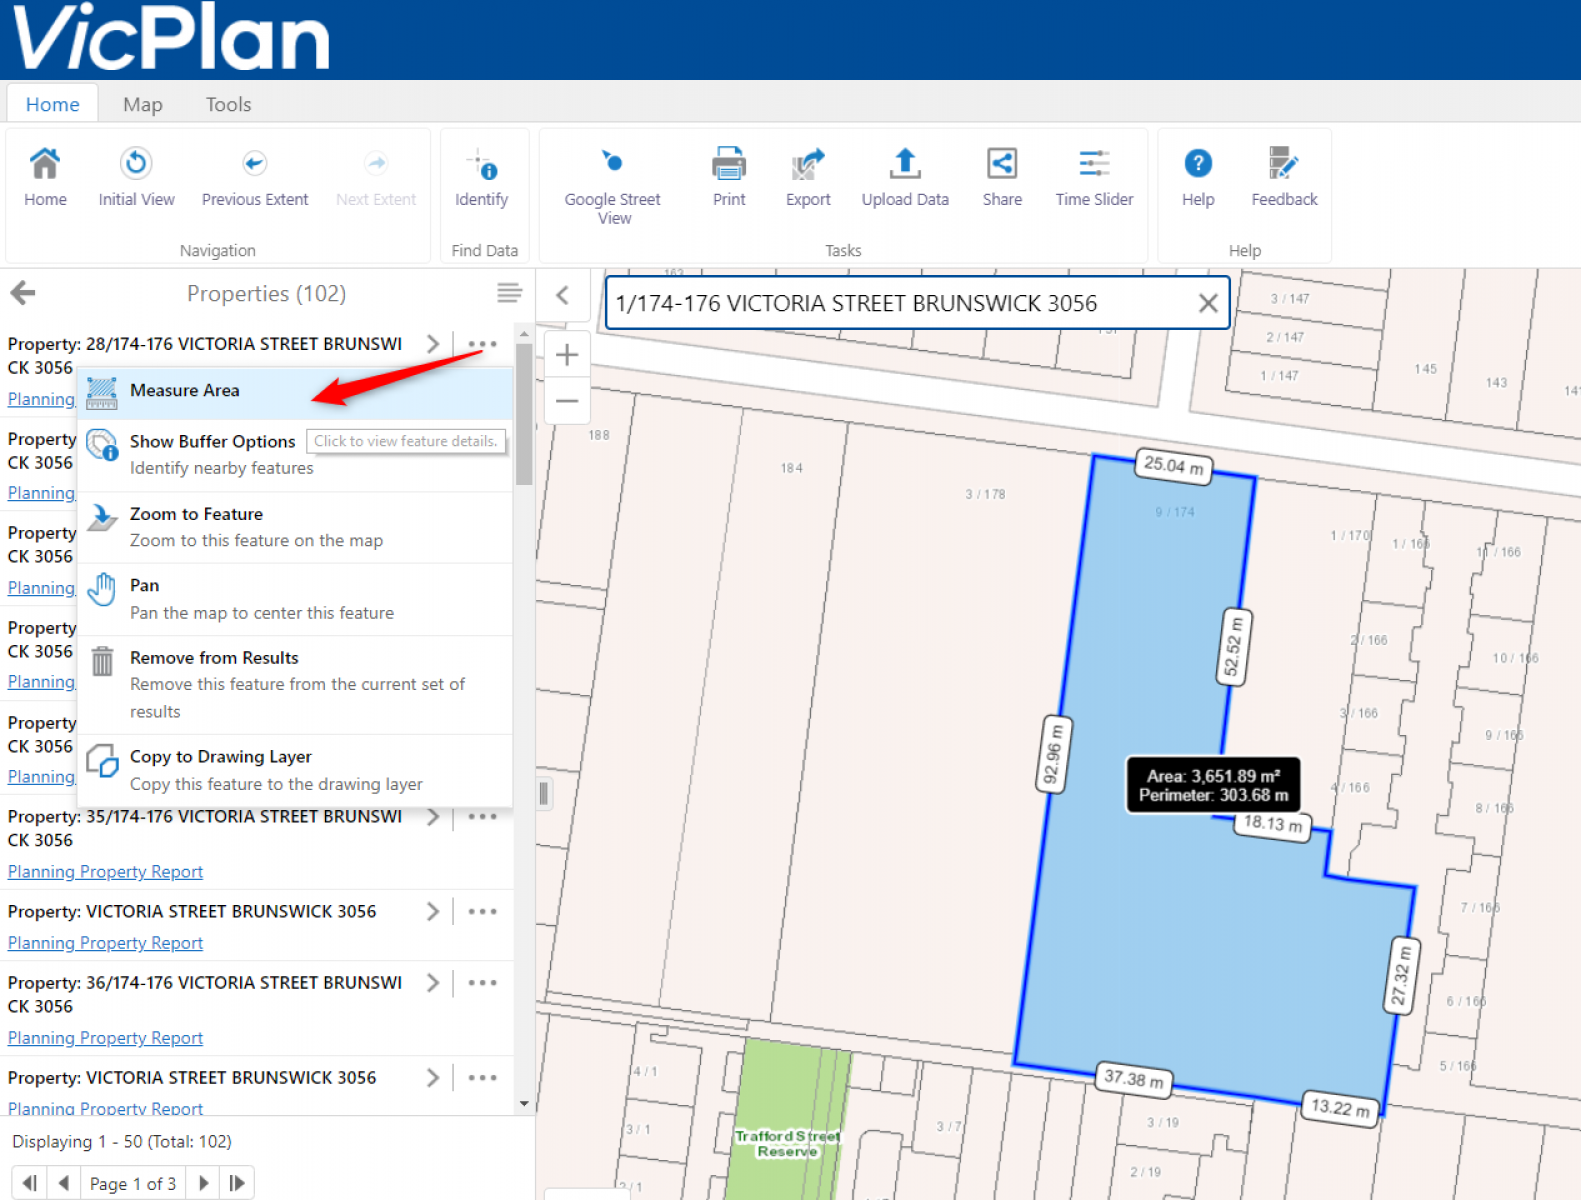
b. Property or Parcel measure
click on the property on the map
go to the information panel and choose either property or parcel
alongside the property or parcel listed open the dropdown menu (…) and choose 'Measure Area'
dimensions and area of the property or parcel chosen are displayed on the map
to remove these temporary markups, go to the 'Tools' menu and select 'Clear'.
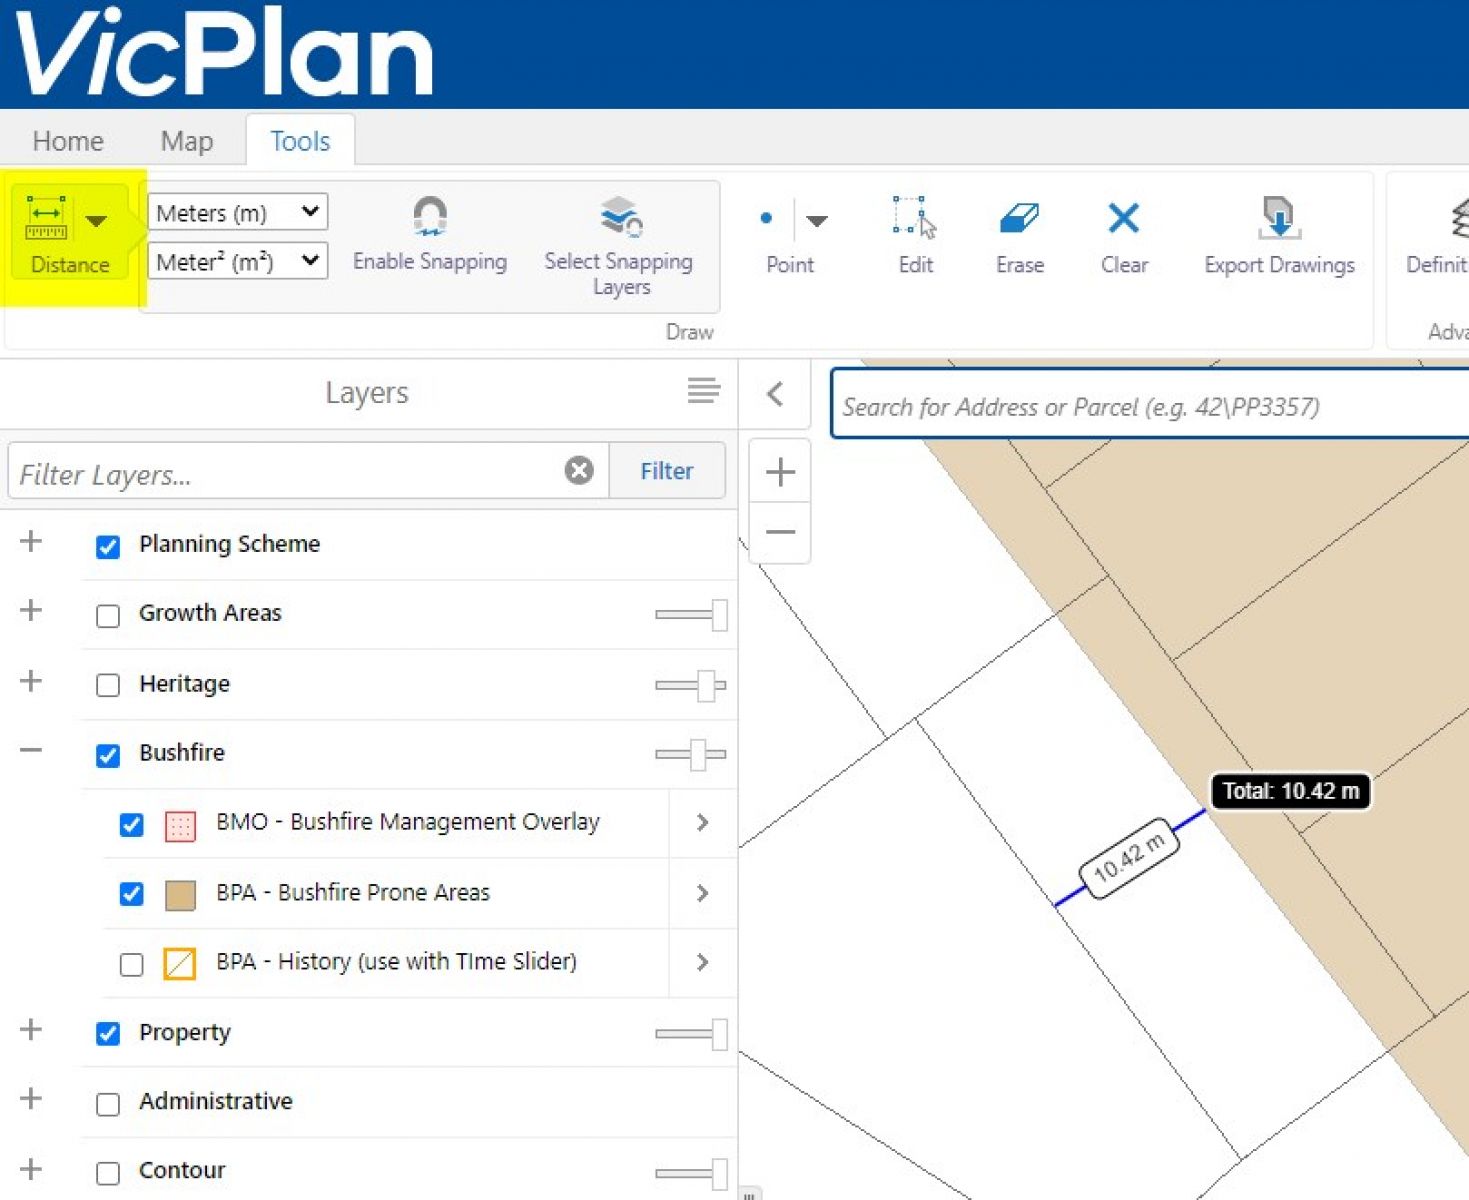
2. Free hand measure
go to the 'Tools' menu
select the dropdown on the 'Distance' button and change to 'Area'
select points on the map to create an area
'Enable snapping' will snap the line you draw to a layer on the map so you can be more accurate
while 'Area' is selected, you can't use other features or zoom or pan the map – de-select the button to turn it off and return to zoom and pan mode.
To save or print a map, go to the 'Home' menu and select ‘Export’
Measure an area using VicPlan
Measure distances
go to the 'Tools' menu
select the 'Distance' button and the measurement option(s) required
select a start point on the map, move to the end point and double click to complete
for multiple measurements, select a start point, move to the next point and select each subsequent measure, then double click to complete the total distance.
while 'Distance' is selected, you can't use other features or zoom or pan the map – de-select the button to turn it off and return to zoom and pan mode.
For accurate mesauring, turn on 'Enable Snapping' to allows measurements to snap to features on the map. Use 'Select Snapping Layers' to choose specific layers.
VicPlan measure distance on a map
Basemap options
VicPlan has 4 base map options:
Colour: default base map.
Greyscale: a Mapscape base map designed for better zone or overlay comparison to the base map. This base is available up to a 1:5,000 scale.
Aerial: shows the map with satellite imagery. Shows different landscapes on the map, for example vegetation.
Hybrid: view map and aerial imagery at the same time. Select Hybrid and Aerial in the 'Layer list' to view Hybrid.
Change the basemap by selecting the 'Map' icon or the 'Layer list'. Transparency sliders weaken or strengthen the colours on the basemap.
Greyscale basemap for better comparison of zones and overlays
Latest VicPlan release
Release 2.6.2
New data
Car Parking Requirement Maps
Reintroduction of the Aerial imagery basemap, was temporarily unavailable.
Previous VicPlan releases
New data
New Aerial imagery basemap called Image+ offering clearer, more detailed, and up-to-date coverage.
New flood layer called 1% Annual Exceedance Probability (1 in 100 Year) added to the Water and Catchment folder.
New Utility layers added to the Layer Catalogue, namely Urban Water Corporation and Melbourne Water Corporation map layers.
New Features
Local Government Area layer now able to be viewed at all map scales.
New data
Birrarung - Yarra River planning policy and control layers
Completed Precinct Structure Plans Future Land Use layer
Updated aerial photo basemap
New data
Bushfire Prone Area history updated and associate Time Slider adjustment for new dates.
Resumption of Definition Plan service.
Temporary redirected of Definition Plan service to Planning Mapping Services to accommodate system upgrade.
New data
Bushfire Prone Areas update, Distinctive Areas and Landscapes style changes, updates to Planning Property Report, rename of Industrial & Commercial layers and updated Time Slider dates.
New data
Airport layers reinstated, Definition Plan fix and migration of underlying services to new platform.
New data
Distinctive Areas and Landscapes (DALs) in the Layers Panel and Yarra River Protection Act layers in the Layer Catalogue.
New data
The new Housing Choice and Transport Zone (HCTZ) and Built Form Overlay (BFO) have been introduced.
Release 2.5.3
New data
New category named ‘Referred Under Environment Effects Act' added to each layer in the Renewable Energy Facility folder of the Layer Catalogue.
Release 2.5.2
New data
Add Melbourne Industrial and Commercial Land Use Plan maps to Industrial and Commercial folder of Layers panel.
Release 2.5.1
New feature
Planning Property Report migrated to new platform with DTP branding
Historic Planning Scheme Zone maps access adjusted.
Release 2.5.0
New data
The Suburban Rail Loop Planning Area map is accessible via the Layer Catalogue in the Map tab of the toolbar.
Release 2.4.9
New data
Bushfire History and Irrigation Infrastructure map layers have been restyled for colour accessibility
Catchment Management Authority and Utility layers now have associated url links in the Information panel
All these layers are available from the Layer Catalogue in the Map tab of the toolbar.
Release 2.4.8
New data
State Projects updated
Battery Energy Storage System and Bioenergy Facility added to the Renewable Energy Facilities data in the Layer Catalogue
Planning Scheme Boundary added to the Layer Catalogue
Road Casements added to the Property folder in the Layers panel.
New features
Right mouse click for quick access to the property area measurement tool
Urban Growth Boundary improved line style.
Release 2.4.7
New data
Future Homes datasets accessible under the Planning Scheme Folder of the Layers panel.
Improvements to BPA Definition Plan and Water & Power Utilities map containing clearer boundaries in the Layer Catalogue.
Release 2.4.6
New data
Melbourne Airport noise contours from Melbourne Airport’s 2022 Master Plan in the Airport folder of the Layers panel.
Biodiversity Conservation Areas as part of Melbourne Strategic Assessment in the Growth Areas folder of the Layers panel.
Release 2.4.5
New data
Special Water Supply Catchment Areas (SWSCA) replaces the Designated/Proclaimed Water Supply Catchment Areas. This layer is now accessible from the Layers panel in the Water and Catchment folder.
State Project boundaries approved under Clause 52.03 of the planning scheme includes Level Crossing Removal Projects available in the Planning Scheme folder of the Layers panel.
Victorian Planning Authority Precinct Boundaries now accessible from the Layer Catalogue under the Map tab.
Release 2.4.4
New data
Biodiversity Conservation Strategy and updated Water Irrigation Districts layers have been added to VicPlan’s Layer Catalogue.
VicPlan feedback
We are keen to engage with VicPlan users to design future features of VicPlan. Use the feedback form in the 'Home' menu on the toolbar.
Release 2.4.3
New features
Improved Filter tool - a new link in the information panel to quickly filter the map.
Metadata link added to all Zone & Overlay layers to view the data currency and other useful information on these layers.
Improvements to the Bushfire Prone Area (BPA) Definition Plan tool.
New data
Planning Scheme Overlay history layer updated to include Buffer Area Overlay (BAO).
Release 2.4.2
New data
Introduction of new Buffer Area Overlay - BAO added to the Land Management subfolder in VicPlan.
Release 2.4.1
New features
New Definition Plan for Bushfire Prone Areas layer to locate BPA where it does not coincide with a property boundary.
Feedback enhancement to include specific feedback types to better manage and guide user enquiries.
New data
Precinct Structure Plans and Fire Rescue Victoria (FRV) Legislated Boundary added to the Layer catalogue.
Links to the new ordinance pages have been updated in VicPlan.
Release 2.3.1
New data
VicPlan Road Zones and Public Use Zone 4 – Transport zone are being replaced by new Transport Zones.
View the Recognition and Settlement Agreement and the National Native Title Tribunal Spatial Data layers.
Principal Freight Network layers now included in the Transport folder.
Improved map labels speeds up the map display. House number, property address and parcel labels are much faster to display as duplication in built up areas have been removed.
Release 2.3.0
New data
New Transport layers reflect the State Transport System:
Principal Bicycle Network
Strategic Cycling Corridors
Principal Public Transport Network
Regional & Metropolitan Rail
Principal Road Network
Principal Transport Gateways.
Time Slider max date updated to reflect recent BPA History update. This also assists Historical Planning Scheme Zones, Overlays and Bushfire History.
Release 2.2.9
New features
My Location Tool – a geo-location feature useful for mobile devices to pinpoint your device location on the map.
Heritage Overlay Search – improved search for Heritage Overlay numbers within specific Local Government Areas and planning schemes.
New server infrastructure
Fixes to VPP ordinance links
Improvements to the search tool for wind and solar farms, heritage sites (HERMES and Victorian Heritage Numbers).
Release 2.2.5
New features
Planning scheme amendment search tool in the Map menu in the main toolbar
Shortcut buttons to turn ON/OFF all zones and overlays in the main toolbar
Postcode and parish name included in the search
Additional help in the FAQ section on bushfire control impacts
New data layers are accessible via the Layer catalogue in the Map menu of the main toolbar. See the Boundary and utility folders in the Layer catalogue.
New data
Special Water Supply Catchment Area
Catchment Management Authority boundaries
Water authority boundaries and many other administrative boundaries
Release 2.2.4
New data
History of planning scheme zones, overlays, amendments and property boundaries at a point in time
Exhibited Map Amendments with additional layer highlighting new exhibitions
Wetlands data including Ramsar Sites and Extractive Industry Work Authorities added to the Layer catalogue
1985 historic planning scheme map repaired and now available
New features
Try the new time slider to interact with histories of the planning scheme and associated property layer
Link from each map Amendment to the Amendments web page for status and details
Search by Hermes number for Heritage Inventory and Register sites
Search by Crown land descriptors, eg. Parish Barp Allot 27A Sec F (27A~F\PP2080)
Measure Area tool for simple and accurate areas of property and other features
Release 2.2.3
New data
Switching between base maps issue has now been resolved
Overlay Filter tool issue resolved
Planning Scheme Overlay display resolved.
Release 2.2.2
New data
Customise the styles of both property and parcel map layers
User survey available on start up
Repair to the historic 1985 planning scheme map, missing sections replaced
Fix of overlay map labels.
Release 2.2.10
New features
Protected Settlement Boundary (PSB) layer added following introduction in the planning scheme – also forms part of the Planning Property Report in the Planning Overlays section.
Fix to the Time Slider dates for layers using this feature.